Healthcare Data Visualization: Examples, Benefits & Challenges

Slava Khristich


Vlad Nazarov

| ? Medical data visualization is still a bit underrated in terms of health data analytics and representation. However, this superior method has gradually become a mega-trend and game-changer in the industry. For many years, data visualization in healthcare has not been widely adopted and has remained massively underused by the majority of medical professionals… Everything has changed, however, since digital health management technologies were introduced to the market. ? In this article, we’ll discuss… ✅ How medical data visualization works. ✅ How data visualization for healthcare improves processes. ✅ Methods and tools used to visualize clinical information. ✅ Development of patient data visualization software, and more. |
Why is healthcare data visualization a booming practice these days? ? ?
Data visualization in the healthcare industry is the representation of complex medical stats in a digestible graphical format. It allows users to easily obtain qualitative insights, changes, patterns, and trends while drawing valuable conclusions…even without developed math skills. Collaborating with a healthcare IT consulting company can assist in implementing effective data visualization tools tailored to your organization’s specific needs.
The medical professional community has recently discovered the additional opportunities and powers granted by digital medical data graphical representations of different types, such as…
- Charts
- Graphs
- Diagrams and flowcharts
- Tables
- Maps
- Infographics
- Dashboards.
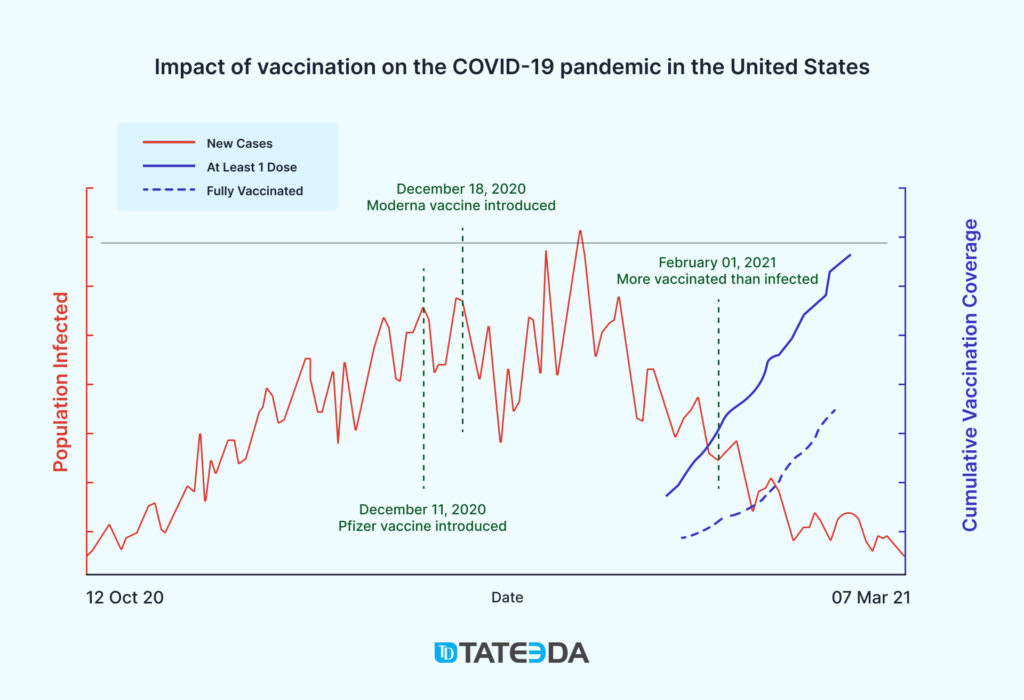
You can see an example of a visual representation of health data below: a graph demonstrates a clear correlation between certain medical matters and events, which provides physicians and epidemiologists with evidence that their activities lead to improvement of the situation…
Previously: In the pre-computer era, clinical data visualization was only available to a very narrow group of medical scholars, administrators, and analysts.
Nowadays: Thanks to the global digitization of healthcare, almost all physicians, nurses, and even patients can benefit from using data visualization tools and methods.
Why? Learn from this table…
| In the past… | Nowadays… | |
| Data collection & aggregation | Tedious manual work that required a significant amount of time and effort. ? | A mostly automated process that requires connection to an electronic database and a few clicks. ?️ |
| Calculations | Slow handwritten calculations in paper notebooks. ? ? | Electronic operations; instant calculations. ⚡ |
| Building graphs with conclusions | Visualizing and interpreting medical data required sufficient mathematical skills. ?? | Charts are built automatically along with auto-generated analytical conclusions. ?? |
| Access to data | Hours spent working with dusty papers in a patient documentation archive or medical-record repository. ?? | Permission-based (login/pass) access to a database from any location or smart device. ? |
More and more medical data is being ingested, stored, and organized in electronic systems like custom EMR/EHR software. This makes clinical data visualizations accessible through an increased number of digital tools, including…
- Smartphones, tablets, and computers.
- Apps, websites, modules, and widgets.
- Interactive software dashboards.
- Exported documents and spreadsheets.
Before you proceed to read about data visualization in healthcare and the development of software solutions capable of this function, take a minute to learn about our company or book a free chat with our chief technical specialist: ?

Slava Khristich
Healthtech CTO
Based in San Diego, Slava knows how to design an efficient software solution for healthcare, including IoT, Cloud, and embedded systems.
| Who are we? TATEEDA GLOBAL is a custom software development company based in the United States. We can help you implement data visualization in your healthcare technology product. ✔️ Deep expertise in the engineering of custom healthcare applications with Cloud, IoT, mobile, web, and desktop components. ✔️ HQ in San Diego, California: Nearshore custom software development in a convenient time zone for North American customers. ✔️ Dedicated project managers and engineers offering personalized communications and unlimited tech consulting. Contact us today for a free consultation! |
Table of Contents
Medical Data Visualization: How It Works
Let’s check through the major components necessary for visualizing health data on computers and smart devices for medical professionals and other healthcare stakeholders.
Where to find health data for efficient visualizations: potential sources
Clinical data visualization relies on details found in electronic patient record systems and a variety of other statistically sound and legally valid sources, including…
?️ EHR and EMR solutions
These systems can include enormous arrays of both qualitative and quantitative patient health data incorporating…
- individual medical histories
- diagnoses and treatment plans
- physiological data captured through IoT medical devices
- medical examination and lab test results.

| About EHR and EMR: “With this type of technology, public health workers can achieve healthcare quality that has never been achieved before. It is much safer for patients, results-focused, evidence-based, time-efficient, and highly productive…” Learn more: ➡️ Custom EHR/EMR Software System Development. |
? Data collection forms
Patient data and feedback can be extracted from patient data-capture solutions, like…
- health surveys
- scorecards for health tracking
- patient self-reporting forms
- insurance claims
- insurance company databases.
? Clinical trials
Examination of innovative medical products and methods can generate ample amounts of valuable health information that is recorded in a database, then rigorously analyzed and interpreted for deeper insights.
⌚ Wearable and portable devices
Customer-grade or professional-grade wearables can collect large amounts of health data from people of various groups, genders, ages, conditions, and lifestyles. These wearable devices can be…
- fitness trackers
- pulse oximeters
- wearable ECG monitors
- wearable blood pressure monitors
- biosensors of different types.
? Third-party platforms
This covers a wide range of technologically diverse data repositories:
- external Big Data platforms
- cloud-based datastores
- digitized patient archives
- API-based integrations.

Learn more: ➡️ Data Mining in Healthcare: Examples, Techniques & Benefits
Necessary provisions for healthcare data visualization
? Sufficient amount of medical data
Healthcare data visualization works the best when it is fueled by volumes of well-structured information. This enables health professionals to view different types of combined charts covering prolonged periods in order to come up with comprehensive conclusions.
For example, if you can tap into the massive data repository of an EHR/EMR system, you can mine it for valuable insights by visualizing information in a multitude of ways.
? Well-elaborated mathematical models supporting patient data visualization
The digital brain or software component underlying clinical data visualization must contain well-founded mathematical logic and algorithms. This mechanism must work flawlessly to convert medical data into accurate, comprehensive graphics. Life-changing decisions could be made based upon these visualizations, so there should be an abundance of information to connect the dots and NO chance for mistakes.
| Medical specialists don’t need to possess advanced math skills or know the algorithms behind health data visualizations. Instead, they require actionable takeaways that are applicable to their goals and activities. There exist numerous ready-made modules, programming libraries, and other software components that provide the required mathematical models and can be integrated into software solutions to save you time and money. |
✅ Convenient clinical data visualization toolbox and interface
It’s necessary to design and build a highly usable interface with easy-to-use controls so medical professionals can benefit from visualized healthcare data without struggling with a steep learning curve. The visualization management panel can be implemented into existing medical solutions like EHR/EMR client software or created as a standalone application for web or mobile platforms.
Do you want to develop a solution for medical data visualization?
| ⚡ We can help you build an application or a new software module for medical data collection, aggregation, and data visualization in the health industry. If you have some ideas and want to discuss technical implementation, please book a free chat with one of our seasoned health-tech experts: ? |
Health Data Management Software Solutions
Let’s explore what health data needs visualization and how—we can assist in creating a custom data representation app for you.
How Software Facilitates Data Visualization in Healthcare: Tools, Interfaces, and Examples
Thanks to the ultimate flexibility and endless possibilities offered by custom software development, there are many ways for healthcare professionals to process and view medical data with smartphones, tablets, and desktops.
Let’s consider some of the most popular clinical data visualization tools in healthcare…
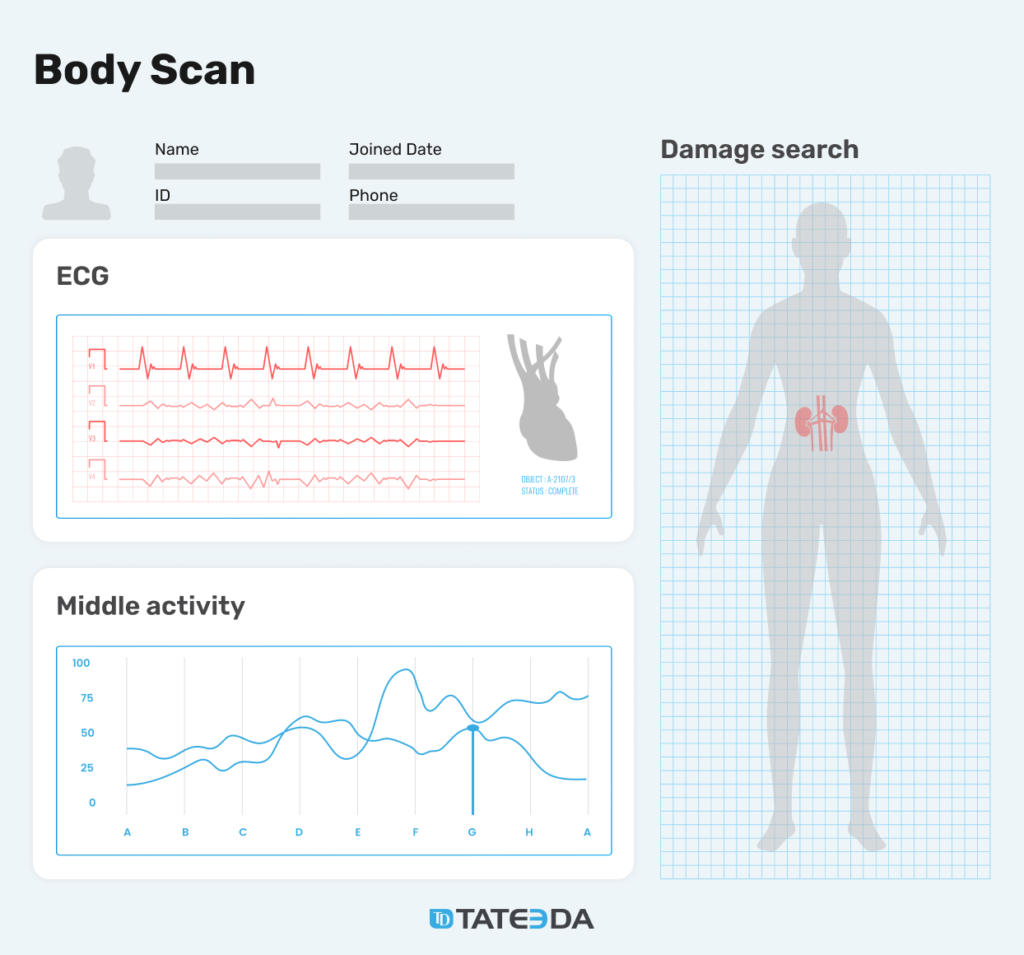
Interactive Dashboards
One of the most common and efficient patient data visualization methods is building charts through multi-functional dashboards. A custom dashboard can include dozens of tools and controls for efficient visualization of healthcare data…
- vitality metrics instantly captured from patients via electronic sensors
- adjustable filters and zooming scales
- chart type selectors
- detail level settings
- search capabilities
- …and much more.
| Medical data visualization dashboards are powerful instruments that work best for advanced users, including healthcare analysts/experts and healthcare facility administrators. Thanks to numerous settings, they provide sophisticated capabilities for deep clinical process analysis. ?? |
These digital healthcare information dashboards can be developed as a standalone app and connected to an existing EMR/EHR system or created as an additional module within a software system. Please see a clinical data dashboard example here: ?

| ECG graphs: One bold example of professional medical data visualization is ECG charts or cardiograms that require specific medical education and skills in order to be read and interpreted. These charts can help cardiologists not only detect a cardiac illness early but also prevent acute conditions in cardiac patients. Virtual ECG information diagrams can be combined with digital dashboard tools providing cardiologists with enhanced analytical capabilities ??⚕️ Learn more: ➡️ Remote ECG-monitoring Software Development. |
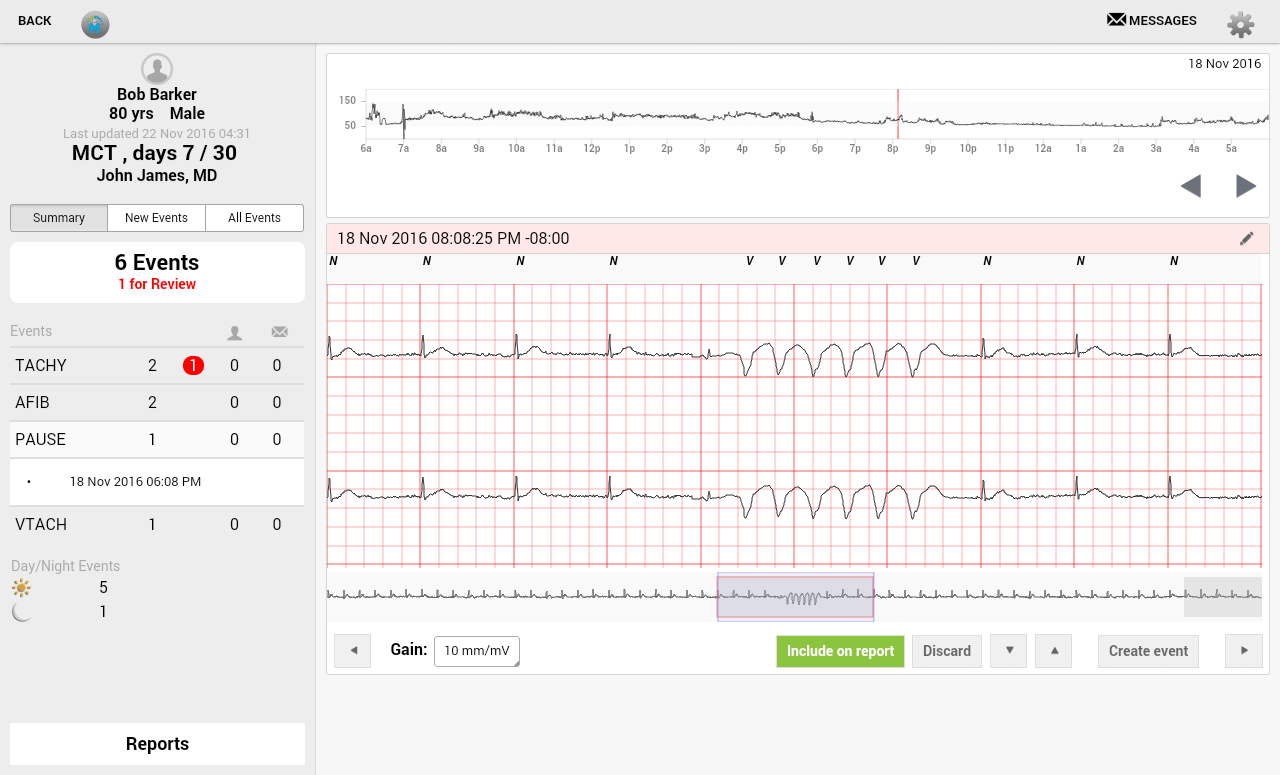
Interactive Apps, Websites, and Widgets
Sometimes, healthcare specialists and/or nurses require a very specific or limited set of data visualization functionalities. They do not necessarily need complex, multi-functional dashboards.
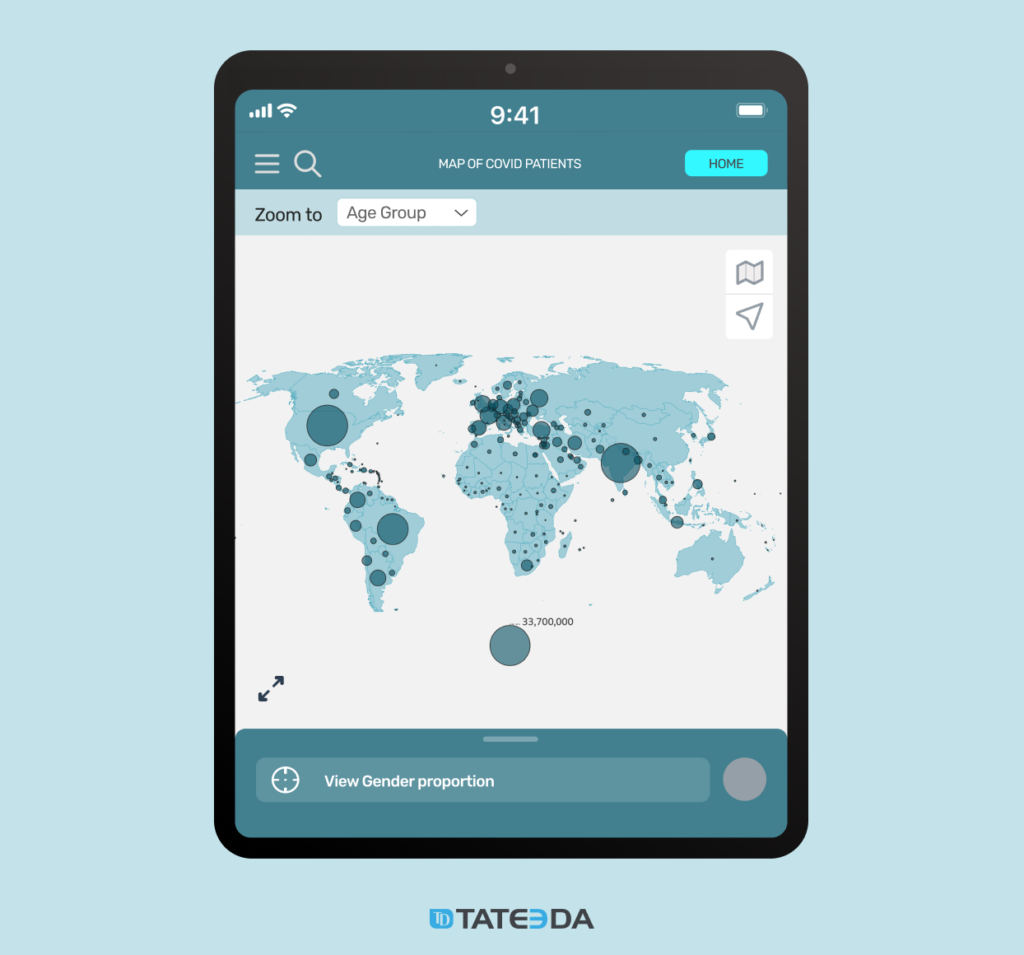
In this case, it’s better to build a neat, fast, narrowly focused application (web or mobile) that allows medical specialists to generate a certain type of health data visualization with minimal settings.
| This type of app, web interface, or widget can be also connected to EMR or EHR and/or any other patient database to extract and visualize medical data according to predefined rules and permissions. The advantages of this solution include simplicity for users and limited role-based access permissions. ?? |
Developing this type of app or widget normally takes less time and effort than building a powerful dashboard. Here you can see an example: ?
Learn more: ➡️ Healthcare Product Development: How to Build an MVP
Infographics and Motion Graphics
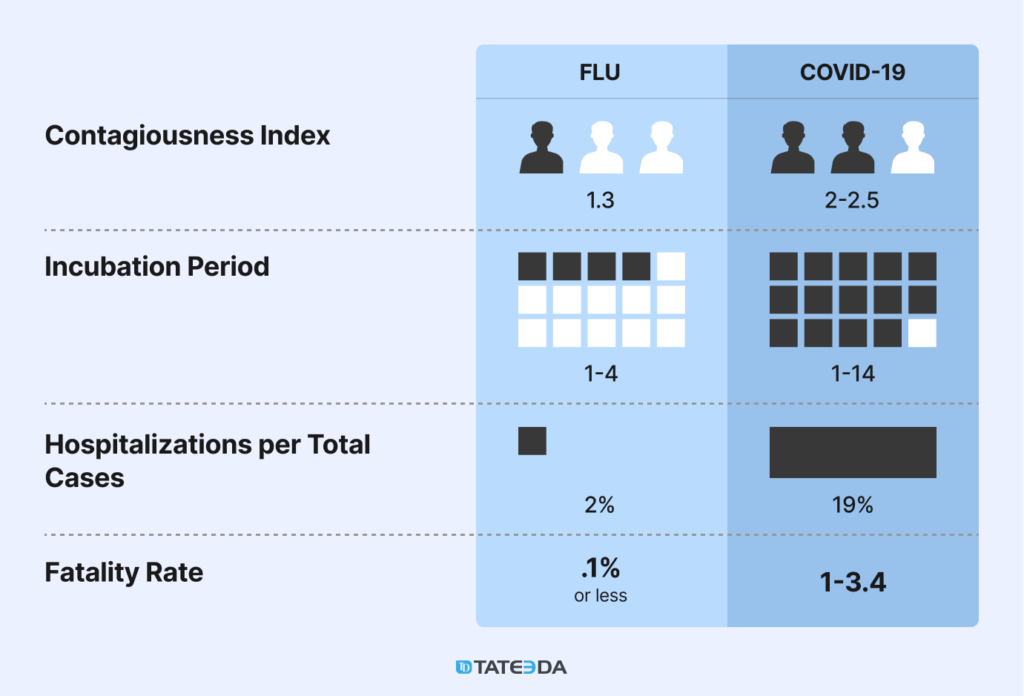
An infographic is a simple yet powerful educational tool that works best with a wider audience, especially when it’s necessary to represent important medical information in a popular format. Infographics or animated videos are easy to understand, and have greater potential for going viral on the web. This tool helps tell a story that catches the attention of non-professionals and spreads the word.
| Good healthcare infographics do not require qualifications to be interpreted and understood. They are created by visual designers but can be also generated with the help of specific template-based software products that allow users to assemble infographics from existing graphical objects. ??️ |
This type of data visualization in healthcare usually contains public educational data that can be communicated to people with limited medical knowledge. Here’s an example of medical infographics: ?
Are you interested in developing a custom healthcare data visualization tool?
| ⚡ At TATEEDA GLOBAL, we can help you design and develop a web-based or mobile application, widget, or full-fledged dashboard for visualization of data in healthcare, biotech, science, and/or other relevant fields. We are seasoned professionals in custom biotech and healthcare software development, including comprehensive UI/UX design. Please see a complete list of our medical software development services here: ? |
Custom Healthcare Solutions
See how we can engineer healthcare software, validate your ideas, and manage project costs for you.
How Data Visualization Improves Healthcare: 6 Examples Explained
The main reasons for using clinical data visualization in healthcare activities include a wide range of measurable advantages that improve medical practices on a daily basis. With this type of visual information, medical facility administrators can access a fuller grasp of the situation and be empowered to take corresponding actions…
#1. Improved patient care for clinics and medical centers
With the help of clinical data visualization, it’s easier to track changes in patient satisfaction levels. For example:
- You can easily build a graph showing the numbers of satisfied and dissatisfied patients or clients over a period.
- Compare the numbers from a monthly or annual perspective.
- Visualize a decrease or increase in patient satisfaction metrics according to specific groups of patients.
- Analyze the reasons for these changes as reported.
#2. Professional-grade visualization for medical devices
Whether traditional or innovative, medical equipment requires a comprehensive user interface that can be easily read by healthcare professionals. With the help of professional medical data visualization, physicians and nurses can…
- Perform biosignal monitoring or organic tissue scanning in patients.
- Interpret received signals in the form of diagrams and animated visualizations to identify patient health conditions.
- Manage and tune up medical devices to improve visual detail and angle until the best diagnostic quality is achieved.
#3. Improved access to data insights for physicians
Medical professionals can use data visualization dashboards connected to EMR/EHR systems to generate different types of diagrams and charts. For example, they can be used to…
- Visualize performance and hours spent with individual patients or certain medical activities (personal consultations/ sessions, telemedicine, working with documents, and more.)
- View stats and metrics per patient in terms of conditions, treatment plans, and results.
- Create health data graphical reports, print/share healthcare stats, and visualize outcomes for patients and colleagues.

| Medical data visualizations can be used with the mental health EHR/EMR system because with their help, “…mental health professionals can identify patterns, correlations, and/or trends in patient behaviors and symptoms. This provides a profound background for deeper scientific research and helpful medical conclusions.” Learn more: ➡️ Mental Health EMR Development |
#4. Trends and pattern recognition in healthcare activities
If you have access to vast volumes of medical data, visualization can give you unlimited opportunities to observe trends and patterns, and find and understand correlations between events and their consequences in medical practice. For example:
- You can discover declines, inclines, or plateauing in certain disease incidences.
- Identify the frequency of specific symptoms in different patient groups.
- Find relevance to seasonal, gender, social, economic, and other factors.
- Define how your activities, like the adoption of new treatment protocols, affect patient conditions, treatment outcomes, and feedback.
- Draw prognoses for future periods based on current trends and data patterns.
#5. Various levels of medical data presentations
Different audiences require different approaches to medical data visualizations. With the help of custom clinical data visualization tools, you can create a wide range of visual data representation types, including…
- Graphs showing professional medical service metrics for investors and stakeholders that demand reports on your hospital, clinic, or medical center’s accomplishments and achievements.
- Popular infographics for current patients and healthy citizens who should be informed about potential disease symptoms and prevention methods.
- Depiction of medical facility business metrics over periods of time in the context of inner reporting for healthcare staff and administrators.
#6. AI-powered predictive analytics in healthcare
Health data visualizations can be based on more than current data or archived records. With AI and ML technologies, visualizations can also help predict future situations in healthcare. For example…
- Spikes or decreases in diseases and health problems based on trends, patterns, and factors.
- Upcoming workforce shortages in the medical industry, in general, or locally.
- Expected efficiency of certain treatment plans and methods in specific patient groups.
- Business forecasting and intelligence for medical centers and private healthcare providers.
Interested in improving your medical practice with data visualization?
| TATEEDA GLOBAL can help you design, develop, and/or implement a medical data visualization tool. This can include integration with your current EMR or EHR solution. We have deep expertise in engineering interoperable healthcare software. Learn more about our medical software projects: ? |
Delivered Healthcare Software Portfolio
The leading American healthcare companies benefit from working with us.
Challenges Healthcare Organizations Face in the Process of Visualizing Data
? The key objective for all data visualization tools in healthcare is to acquire actionable insights and valuable takeaways to drive reasonable change. There are some situations and reasons that could cause medical visualization to fail in these areas.
Let’s check them out…
- Insufficient data or poor structuring of data objects in the database.
- Incorrect mathematical models behind graphical figures and charts.
- Flawed code quality that leads to incorrect conversion of data into visualizations.
- Poorly designed and/or inefficiently debugged user interface.
- Inaccurate interpretation of visualized data.
- Erroneous data visualization settings.
How to Implement Software for Actionable Data Visualizations in Healthcare: The Strategy
- Assign an experienced CTO or software specialist who can find and compare existing software packages for graphical representation of clinical/healthcare information, and choose the best one for your requirements.
- If you have an EHR or EMR system, decide whether you need to connect an additional graphical module or application with data visualization functionality.
- Identify if you need custom software development for your data visualizations: Draw a plan of desired features, tools, platforms, and functionalities.
- Hire an IT team capable of developing a custom healthcare data visualization application or addition. There are different types of software developers and collaboration models available in the healthcare sector.
- Consider full-scale software development outsourcing, including project management, software engineering, and quality assurance for healthcare data visualization tools.
Learn more about our projects in data analytics and visualization in health care: ?
Why Choose TATEEDA GLOBAL for Healthcare Data Visualization
TATEEDA GLOBAL is here to help you build a custom software solution. Our team includes skilled software engineers in web, mobile, and desktop development, plus UI/UX designers who know how to visualize information perfectly.
We have developed or assisted as software engineers and outsourcers in the following healthcare visualization areas…
✅ Dashboards for complicated biotech hardware and software solutions.
✅ ECG visualization development and associated remote monitoring.
✅ Pharmaceutical admin panel development for inventory management.
✅ Electronic patient data capture forms.
✅ Healthcare staff-management dashboards.
Interested? ➡️ Contact us for a free consultation

FAQ: The Importance of Clinical Data Visualization
What types of data visualization are most used in healthcare?
Almost all chart types are used in healthcare, including pie charts, Gantt charts, bubble charts, treemaps, scatter plots, density maps, and more. There exist countless third-party components, programming libraries, and external services that can be integrated into an application, enabling it to build charts along with additional functionalities developed on demand. This approach can save you a great deal of time and money.
Is it possible to create custom data visualizations for hospitals and pharma?
Of course! Multiple technologies can be used to design and customize health data visualizations and graphical content for presentations, business reporting, and data-driven decision-making in medical practice. In order to create a consistent and powerful solution, it’s recommended to seek out the assistance of professional programmers and developers. A data visualization module can be integrated with ERP systems used in hospitals and medical centers.
What are the benefits of data visualization in healthcare?
Data analytics and visualization in health care are the cornerstone methods of all modern medical practices and processes: healthcare analytics examples include MRI diagnostics, sonography, and other instrumental medical research technologies plus sophisticated computed methods for enhanced data interpretation. Each existing method unveils its specific advantages of data visualization, so medical professionals often combine several diagnostic approaches to get more precise results for each patient. If you are seeking qualified assistance for creating or implementing of data visualization tools in healthcare, TATEEDA GLOBAL can help you with IT consulting and other services. Contact our data visualization development specialists for individualized consulting…
Do you provide clients with pharmaceutical data visualization services?
Sure, we worked with several clients from the pharma industry, including pharmaceutical product distributors and manufacturers, and we helped them implement certain pharmaceutical data visualizations like spreadsheets, Pie charts, business process flowcharts, and other graphical reports and IT solutions for visualizing pharma inventory management. If you represent a pharma company and are looking for a reliable tech partner capable of developing a custom application for building pharmaceutical and/or medical graphs and charts, make sure to contact us for more details!
What about IoT-connected data visualization in healthcare practices?
We can help you design and deliver IoT applications that collect, normalize, organize, and visualize medical data from various connected devices, including AI-augmented telemedicine solutions. Contact us for more information on our skills and capabilities in the field of IoT-based solutions in healthcare, including health data capture, accumulation, and visualization through web-based dashboards and/or versatile mobile applications.
What is the average cost of a healthcare data visualization development project?
The price of a software development project depends upon multiple factors, including the scale of the software, specific features, the number of different visualization options and functions implemented, the exact composition of the development team, and much more. Estimated project cost can fall within $50,000-100,000, and the time frame can be 6-12 months. However, if you need a more precise estimation, please book a free chat with us!