How to Build a Revenue Cycle Analytics Dashboard for Medical Practices

Slava Khristich



Vlad Nazarov

In this article, we explain how a revenue cycle analytics dashboard connects claim submissions, clearinghouse acknowledgments, payer responses, remittance data, denials, payments, and accounts receivable into one reporting layer. You will learn which data sources matter, how 837-to-835 reconciliation works, why AR snapshots are necessary, and how to organize dashboards for billers, managers, and executives.
A revenue cycle analytics dashboard is an operational reporting layer that tracks claims from submission through payer response by combining 837 claim data, clearinghouse acknowledgments, claim-status feeds, and 835 Electronic Remittance Advice.
It helps medical practices see which claims were accepted, rejected, denied, paid, adjusted, delayed, reversed, or left without a usable response.
The dashboard works when its underlying data is trustworthy. Submitted 837 claims must have individual claim lines reconciled against one or more related 835 remittance records, including partial payments, denials, contractual adjustments, reversals, corrected claims, and secondary-payer activity.
Key takeaways:
- The EDI 835 Electronic Remittance Advice is a primary source for payer decisions. It shows what was paid, adjusted, denied, reversed, or assigned to patient responsibility.
- An 837-to-835 reconciliation view is often more useful than a basic denial chart because it exposes submitted claims with no conclusive payer response.
- Claim rejections and claim denials are different. Rejections usually occur before payer adjudication; denials occur after a payer processes the claim.
- The 999, 277CA, 276/277, clearinghouse status feeds, and 835 ERA represent different stages of the claim lifecycle.
- CARC and RARC codes need an operational classification layer before billing teams can use them for root-cause analysis.
- Point-in-time AR reporting requires stored snapshots. Rebuilding historical AR from current balances can distort past trends.
- HIPAA permits many payment and healthcare operations activities, but the analytics environment still needs role-based access, audit controls, vendor review, and minimum-necessary PHI exposure.
- A custom revenue cycle analytics dashboard makes the most sense when a practice has multiple systems, multiple clearinghouses, custom payer scorecards, or EHR-to-billing reporting requirements.
Why TATEEDA Is Qualified to Tell You About Revenue Cycle Analytics
Since 2013, TATEEDA has developed healthcare, pharmaceutical, billing, and data-intensive software for U.S. clients. Our 100+ specialists work across medical billing platforms, API integrations, cloud infrastructure, analytics, QA, database engineering, and HIPAA-aware access controls.
This background gives our team practical experience with the systems behind revenue cycle reporting, including claims workflows, payment data, financial dashboards, cross-system integrations, and role-based access to sensitive healthcare information.
Relevant experience includes:
- SCRx pharmacy claims automation, which reduced manual processing work fivefold.
- Travel Nurse healthcare platform, which included automated financial reporting, time tracking, mobile applications, and large-volume operational data.
- Custom medical billing, patient payment, insurance, and healthcare integration projects involving secure data exchange and reporting.
- Senior engineering support across backend development, databases, DevOps, testing, UI/UX, and project management.

Table of Contents
Illustrative scenario: the denial rate looked fine, but the money was missing
An internal medicine group operates a four-provider practice in suburban Chicago. Its practice management system reports a 4.2% denial rate, comfortably inside the target range leadership expects.
Nobody looks at unmatched claims.
When engineers create a revenue cycle analytics dashboard, the first report they populate is not the standard denial chart. It is the 837-to-835 reconciliation view: submitted claims with no returned remittance or other conclusive status after 30 days.
The report exposes a substantial population of outstanding claims with no corresponding 835 response. Some are still waiting on payer adjudication. Some failed clearinghouse processing. Some never received follow-up after a submission-batch error. Others are approaching their payer-specific timely-filing deadlines.
The billing team did not see this population because the practice management system’s denial report counted only claims that had received a payer decision. Claims that disappeared between submission and adjudication were outside the scope of the report.
Many revenue cycle reports share this blind spot. They measure what payers said. A better revenue cycle analytics dashboard also measures what payers have not said, where claims are stuck, and which unresolved items need attention before revenue becomes unrecoverable.
This article explains how to build a custom revenue cycle analytics dashboard: billing data flow, 837 and 835 reconciliation, acknowledgment tracking, AR snapshot modeling, denial-category normalization, KPI logic, HIPAA-aware access, and build-versus-buy decisions.
For a broader discussion that connects billing data with EHR, patient portal, and scheduling information, read TATEEDA’s guide to medical practice analytics software.

What a revenue cycle analytics dashboard actually measures
Revenue cycle management covers several connected stages:
- Patient registration and insurance verification.
- Prior authorization and financial clearance.
- Charge capture and coding.
- Claim generation and submission.
- Clearinghouse and payer acceptance.
- Payer adjudication and remittance.
- Denial correction or appeal.
- Patient balance collection.
Each stage produces data. Most practices cannot see all of it in one place.
A practice management system may show charges, claim records, and posted payments. A clearinghouse portal may show acknowledgment files, edits, rejections, and routing status. Payer remittance files show adjudication results. Patient payment platforms track balances, payment plans, and failed transactions.
A standard report inside a practice management system can generally report only on data stored or posted within that system. It may not expose cross-payer denial patterns, unmatched claim populations, service-line remittance details, clearinghouse failures, or expected-versus-actual reimbursement by payer and procedure.
That is the role of a revenue cycle analytics dashboard. It places claim submission data, acknowledgment data, payer response data, payment records, and operational context into one queryable reporting layer.
The dashboard should answer practical questions:
- Which submitted claims have no payer response after the expected processing period?
- Which claims were rejected before payer adjudication?
- Which payers generate the most preventable denials?
- Which CPT and modifier combinations cause repeated rework?
- Which claims are approaching timely-filing deadlines?
- Which AR bucket is growing fastest?
- Which denial categories belong to registration, coding, authorization, or billing follow-up?
- Which users need claim-level detail, and which need aggregate reporting only?
- Which payer consistently reimburses below an expected contractual amount?
- Which submission batches contain abnormal rejection or non-response patterns?
A generic revenue cycle management dashboard may display totals. A custom revenue cycle analytics dashboard should connect each problem to its likely cause, responsible team, and next action.
The data foundation: 837 claims, acknowledgments, claim status, and 835 ERA
The X12 healthcare transaction flow covers claim submission, payment and remittance, eligibility, claim status, and related healthcare transactions.
A revenue cycle dashboard usually needs several transaction types rather than one isolated data feed.
EDI 837: what the provider submitted
The EDI X12 837 transaction is used to submit and transfer healthcare claims and encounters.
The 837P version covers professional claims, such as physician and outpatient professional services. The 837I version covers institutional claims. Dental workflows use the corresponding dental claim transaction.
An 837 claim can include:
- patient and subscriber information;
- provider and billing-entity information;
- payer information;
- service dates;
- diagnosis codes;
- procedure codes;
- modifiers;
- place-of-service data;
- billed units;
- billed charges;
- rendering and referring provider details.
The 837 tells the analytics system what the provider or billing team submitted. It does not show the final payer decision.
999 and 277CA: what happened before adjudication
A claim can fail before payer adjudication.
The 999 acknowledgment reports whether an EDI transaction set passed applicable syntax and implementation-guide checks. A rejected file or transaction may need correction before individual claims progress.
The 277CA reports claim-level acceptance or rejection. CMS describes the 277CA as a claims acknowledgment used to communicate whether individual claims were accepted or rejected. See the official CMS acknowledgment transaction guidance.
These acknowledgments matter because a claim rejected before adjudication may never appear in an 835 ERA.
A dashboard that uses only 835 data can therefore miss an important failure population: claims that did not reach the payer’s adjudication workflow successfully.
276/277 claim status
The 276/277 transaction pair supports claim-status inquiries and responses.
It can help answer questions about claims that have been accepted but have not yet reached final adjudication. Depending on the payer, clearinghouse, and integration, a practice may receive claim-status data through X12 transactions, APIs, portal exports, or vendor status feeds.
The exact data path varies. The dashboard architecture should reflect what each source actually provides.
EDI 835 ERA: what the payer adjudicated
The EDI X12 835 is the Electronic Remittance Advice. It communicates payer decisions and related payment information.
An 835 may include:
- paid amount;
- allowed amount;
- contractual adjustment;
- patient responsibility;
- denial or adjustment reasons;
- service-line payment detail;
- reversal or correction activity;
- payment and trace information.
For revenue cycle analytics, the 835 is central because it contains the payer’s structured adjudication response. It supports denial analysis, reimbursement variance, net collection reporting, payment-posting analysis, and payer scorecards.
A reliable system should not assume a perfect one-to-one relationship between one 837 claim and one 835 record.
One submitted claim can contain multiple service lines. It can receive partial payments, reversals, corrected remittance, secondary-payer activity, or several payment and adjustment events.
The safer model reconciles claims and claim lines against one or more associated acknowledgment, status, and remittance records.
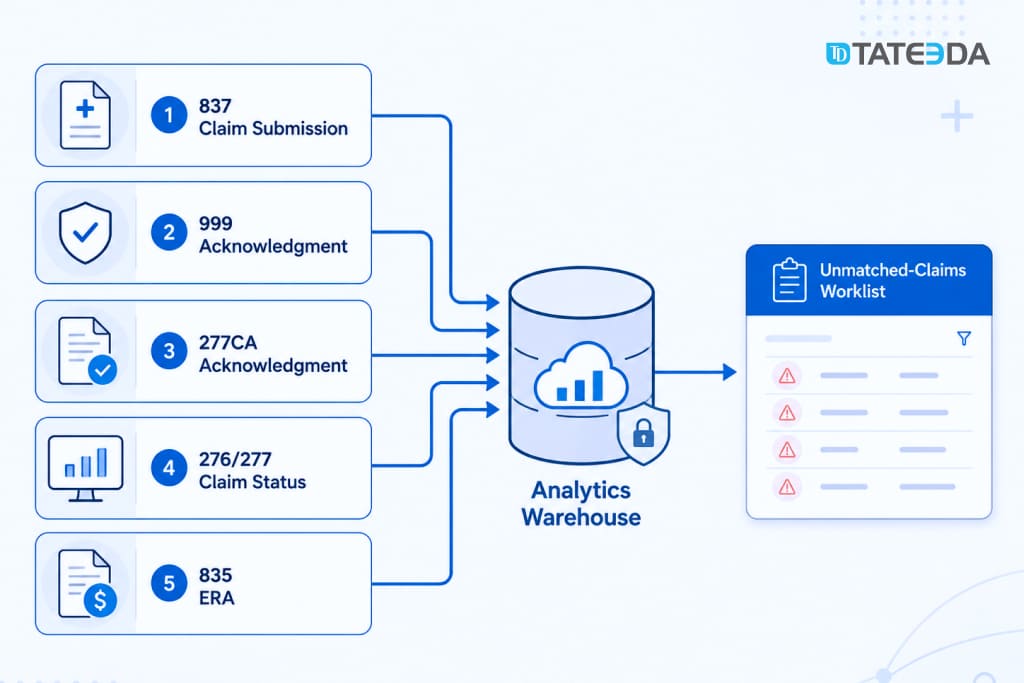
Clearinghouse APIs, payer files, and X12 ingestion
Most practices route claims through a clearinghouse or revenue cycle platform. Depending on the vendor agreement and integration model, the practice may receive claims, acknowledgments, remittance, eligibility, denial, and payment information through:
- APIs;
- SFTP file delivery;
- structured exports;
- vendor reports;
- portal downloads;
- database extracts;
- webhook or event feeds.
Where an API or normalized export is available, it can reduce the amount of raw X12 parsing required. Field availability still varies by vendor, contract, product tier, payer route, and implementation.
Technical discovery should answer these questions:
- Can the clearinghouse provide submitted 837 claim records?
- Are 999 and 277CA acknowledgments available?
- Is 276/277 claim-status information available?
- Can the system expose 835 ERA detail at claim and service-line level?
- Are CARC and RARC values available as discrete fields?
- Are payer claim-control identifiers included?
- Are rejected claims separated from adjudicated denials?
- How are corrected claims, voids, reversals, and resubmissions represented?
- Can data be retrieved by service date, submission date, or remittance date?
- Are historical files available for initial warehouse loading?
- Which vendors handle PHI, and which BAAs cover the data path?
Some practices still need direct X12 ingestion. This may be necessary when payers send remittance files directly, several clearinghouses feed one warehouse, or historical ERA files need to be imported.
The parsing component is only one part of the work. The harder task is interpreting healthcare billing behavior correctly: loops, segments, control identifiers, service-line relationships, payer variations, reversals, coordination of benefits, and adjustment categories.
TATEEDA’s medical billing software development services cover healthcare billing systems, claim workflows, EDI 837/835 adoption, clearinghouse integration, patient payment features, and billing analytics.
The SCRx pharmacy claims automation case study documents TATEEDA’s work with pharmacy claim-processing workflows, third-party API integration, document intake, OCR, notifications, and operational automation.
The 837-to-835 reconciliation view
The 837-to-835 reconciliation view is one of the most valuable outputs in a revenue cycle analytics dashboard.
It answers a deceptively simple question:
Which submitted claims still have no usable response?
The dashboard should compare claim and claim-line submissions against acknowledgments, status records, and remittance data.
Each item can then be classified as:
- generated but not submitted;
- submitted;
- syntactically accepted;
- rejected at the transaction or claim level;
- accepted for payer processing;
- pending payer response;
- paid;
- partially paid;
- denied;
- reversed or adjusted;
- corrected claim submitted;
- secondary payer pending;
- unmatched after the expected response period;
- approaching timely-filing risk.
Claims with no usable response after a defined interval should enter an unmatched-claims worklist.
Thirty days can be a useful initial review point, but the correct threshold depends on the payer, claim type, service category, coordination-of-benefits status, and practice workflow.
The dashboard should not declare every claim older than 30 days as denied or lost. Some claims legitimately take longer. Some require documentation. Some wait for primary or secondary payer processing.
The purpose of the view is visibility. Unresolved claims should appear before they cross filing, appeal, or follow-up deadlines.
Payer-specific timely-filing rules should be stored where contract and policy data are available. A claim that is 70 days old may be low risk under one contract and urgent under another.
Modeling revenue cycle data
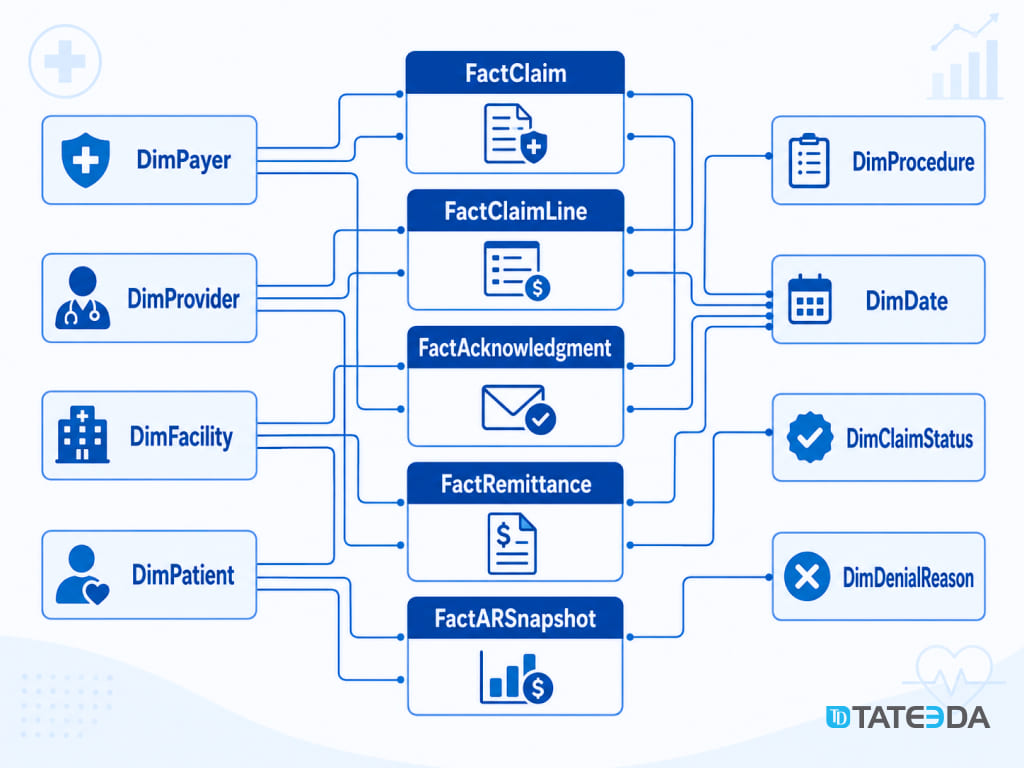
A dimensional warehouse model gives a revenue cycle analytics dashboard, consistent KPI calculations, and manageable query logic.
A practical design can include several fact tables and shared dimensions.
FactClaim
FactClaim stores one row per submitted claim.
Common fields include:
- internal claim ID;
- patient key;
- provider key;
- payer key;
- facility key;
- billing entity;
- date of service;
- submission date;
- total billed amount;
- claim type;
- current analytical status;
- clearinghouse batch ID;
- source system.
This table supports submission volume, payer mix, claim aging, and high-level financial reporting.
FactClaimLine
FactClaimLine stores one row per service or procedure line.
Common fields include:
- claim-line ID;
- parent claim ID;
- CPT or HCPCS code;
- modifiers;
- diagnosis references;
- units;
- billed amount;
- place of service;
- rendering provider;
- acknowledgment status.
This table supports procedure-level denial analysis, coding patterns, reimbursement variance, and provider comparisons.
FactAcknowledgment
A separate acknowledgment fact table can store records from 999, 277CA, and clearinghouse status feeds.
Common fields include:
- acknowledgment ID;
- submission batch ID;
- claim ID where available;
- acknowledgment type;
- accepted or rejected status;
- error or edit code;
- response timestamp;
- source vendor.
This table helps distinguish claims rejected before adjudication from claims denied after adjudication.
FactRemittance
FactRemittance stores payer response and payment records from 835 data.
Common fields include:
- remittance ID;
- payer claim-control number;
- matched claim ID;
- matched claim-line ID;
- allowed amount;
- paid amount;
- adjustment amount;
- patient responsibility;
- CARC code;
- RARC code;
- payment date;
- remittance date;
- reversal or correction indicator.
This table supports denial rates, paid-versus-allowed reporting, patient responsibility, payment analysis, and payer scorecards.
FactARSnapshot
FactARSnapshot stores point-in-time AR balances.
It can record outstanding amounts by:
- claim;
- payer;
- patient responsibility category;
- aging bucket;
- billing entity;
- location;
- snapshot date.
This table is necessary because AR balances change after payments, adjustments, transfers, and write-offs.
If historical AR is recalculated from today’s balance, old reports can change retroactively. A daily or periodic snapshot preserves what AR looked like on a specific date.
It lets the practice answer:
- What did 31- 60-day AR look like on July 1?
- How much AR entered the 90-plus bucket during the month?
- Which payer’s older AR is increasing?
- Which billing entity has the weakest aging pattern?
- Are patient balances growing faster than payer balances?
Dimension tables
Common dimensions include:
DimPatient: patient identity across source systems;DimProvider: provider identity and organizational assignment;DimPayer: payer name, payer ID, category, and contract grouping;DimFacility: clinic, location, billing entity, or tax entity;DimProcedure: CPT or HCPCS code and description;DimDiagnosis: ICD-10 context where required;DimDate: service, submission, acknowledgment, remittance, payment, and snapshot dates;DimDenialReason: raw CARC/RARC values plus operational categories;DimClaimStatus: normalized lifecycle state;DimClearinghouse: source and routing information.
For Medicare payment and RVU context, teams can use the official CMS Physician Fee Schedule. Commercial contract rates and payer-specific reimbursement rules need separate data sources.
TATEEDA’s custom software integration services cover API integration, data exchange, healthcare integrations, database work, and cross-system reporting.
[IMAGE 3: Revenue Cycle Star Schema]
The KPIs every revenue cycle analytics dashboard needs
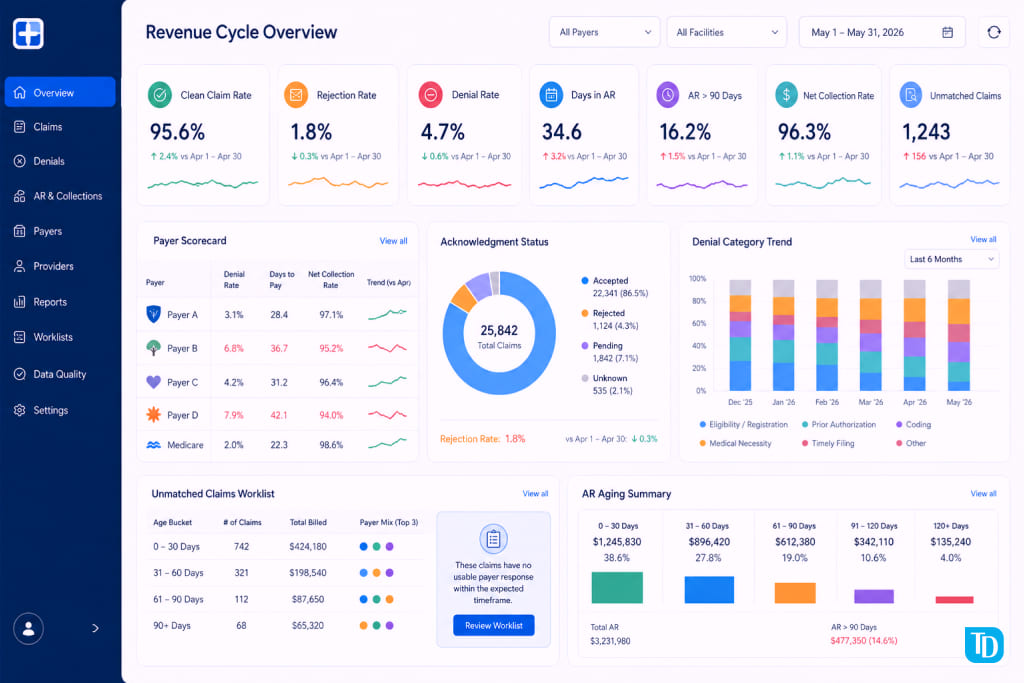
The HFMA MAP Keys provide industry-standard healthcare revenue cycle KPIs with consistent definitions, data sources, inclusions, and exclusions.
Using consistent definitions matters. A practice cannot compare its performance meaningfully when its denominator or inclusion logic differs from the reference metric.
The ranges below are practical reference points, not universal HFMA thresholds. Specialty, payer mix, contract terms, claim volume, patient responsibility, and billing structure can shift acceptable performance.
| KPI | Definition | Primary source | Practical target or note |
|---|---|---|---|
| Clean claim rate | Claims passing applicable edits without manual intervention | Claim-processing tool and 837 workflow | Often targeted above 95% |
| Rejection rate | Claims rejected before payer adjudication | 999, 277CA, clearinghouse feed | Track separately from denials |
| Denial rate | Adjudicated claim or claim-line denials | 835 CARC/RARC data | Often targeted below 5%, but varies |
| Denial rate by payer | Denial percentage for each payer | 835 plus payer dimension | Flag material payer outliers |
| First-pass resolution | Claims resolved without resubmission or appeal | 837, acknowledgment, status, and 835 data | Directional target often above 90% |
| Days in AR | Outstanding AR divided by average daily charges | AR snapshot plus charge data | Common target often below 30-40 days |
| AR over 90 days | Percentage of AR aged beyond 90 days | AR snapshot fact | Often targeted below 15-20% |
| Net collection rate | Collected amount divided by expected collectible amount | Payment, adjustment, and contract data | Often targeted above 95% |
| Unmatched claim rate | Submitted claims with no usable response after the expected period | 837, status, and 835 reconciliation | Keep low and actively reviewed |
| Reimbursement variance | Difference between expected and actual reimbursement | 835 plus fee schedule or contract data | Payer and contract specific |
| Cost to collect | Revenue cycle operating cost divided by net patient revenue | Internal finance and billing data | Depends on operating model |
| Timely-filing risk | Open claims approaching payer filing limits | Claim age plus payer rules | Requires payer-specific thresholds |
Illustrative scenario: the payer scorecard exposed a hidden denial problem
A multispecialty group in Phoenix works with three commercial payers and one Medicare Advantage plan. The overall denial rate appears acceptable at 4.8%.
The payer scorecard tells a different story.
One regional plan is denying a specific procedure category far above the practice average. A standard report shows the denial count. The revenue cycle analytics dashboard shows the pattern: prior authorization denials connected to a limited set of CPT codes and appointment types.
The billing team has been correcting and appealing individual claims for months. The operational fix belongs earlier in the process: authorization verification before scheduling the affected procedure types for that payer.
That is the kind of payer intelligence the dashboard should produce. It should show which payer, which code group, which workflow owner, and which next action matter.
TATEEDA’s health insurance software development services cover payer systems, claims processing, insurance workflows, healthcare integrations, and data-management features.
Denial management analytics: turning CARC and RARC codes into action
The 835 ERA uses Claim Adjustment Reason Codes and Remittance Advice Remark Codes to describe payment adjustments and provide additional explanation.
X12 maintains the official lists of Claim Adjustment Reason Codes and Remittance Advice Remark Codes.
Raw code tables are not enough for operational reporting. A dashboard should add a classification layer that maps code combinations to teams and next actions.
A practical taxonomy may include:
- registration and eligibility;
- missing or incorrect patient information;
- coding;
- medical necessity;
- prior authorization;
- timely filing;
- duplicate claim;
- coordination of benefits;
- documentation request;
- payer policy;
- contract or fee-schedule issue;
- patient responsibility;
- payment posting;
- contractual adjustment;
- payer-specific review.
Exact code mapping should be reviewed against payer rules, specialty context, remittance group codes, remark codes, and the practice’s billing policies.
A code should not be assigned permanently to one operational category without considering the surrounding data. The same adjustment code can require different handling depending on the claim, payer, group code, remark code, contract, and clinical context.
The goal is not to hide raw codes. It is to add an operational interpretation layer.
A raw-code dashboard may say:
CO-96 appears 847 times.
An action-oriented dashboard can say:
A significant share of preventable denials relates to coverage or information problems that require front-end review.
The second version helps a manager assign work and change a process.
Preventable, correctable, appealable, and contractual outcomes
After code normalization, the dashboard can classify outcomes by likely next action.
Preventable denials may be reduced through upstream workflow changes. Examples can include eligibility failures, missing authorization, incomplete registration data, and avoidable filing delays.
Correctable claims may require revised information and resubmission. Examples can include demographic errors, missing identifiers, and certain coding issues.
Appealable denials may have a defensible basis for formal payer review. Examples can include medical necessity or documentation disputes, depending on the evidence and payer policy.
Contractual adjustments should be separated from true denials. They may represent expected write-offs or pricing terms rather than lost revenue caused by an operational failure.
Patient-responsibility amounts also need separate treatment. They are not necessarily denials and may move into patient billing workflows.
This classification connects analytics to ownership:
- Registration teams handle demographic and eligibility data.
- Scheduling or authorization teams handle pre-service approval.
- Coding teams review code selection and documentation.
- Billing teams handle resubmission, follow-up, posting, and appeal routing.
- Contracting teams investigate reimbursement and payer-policy issues.
- Leadership reviews staffing, payer performance, and financial exposure.
The dashboard should show outcome type, responsible team, recoverable amount, aging, and recommended next action.
Dashboard views by role
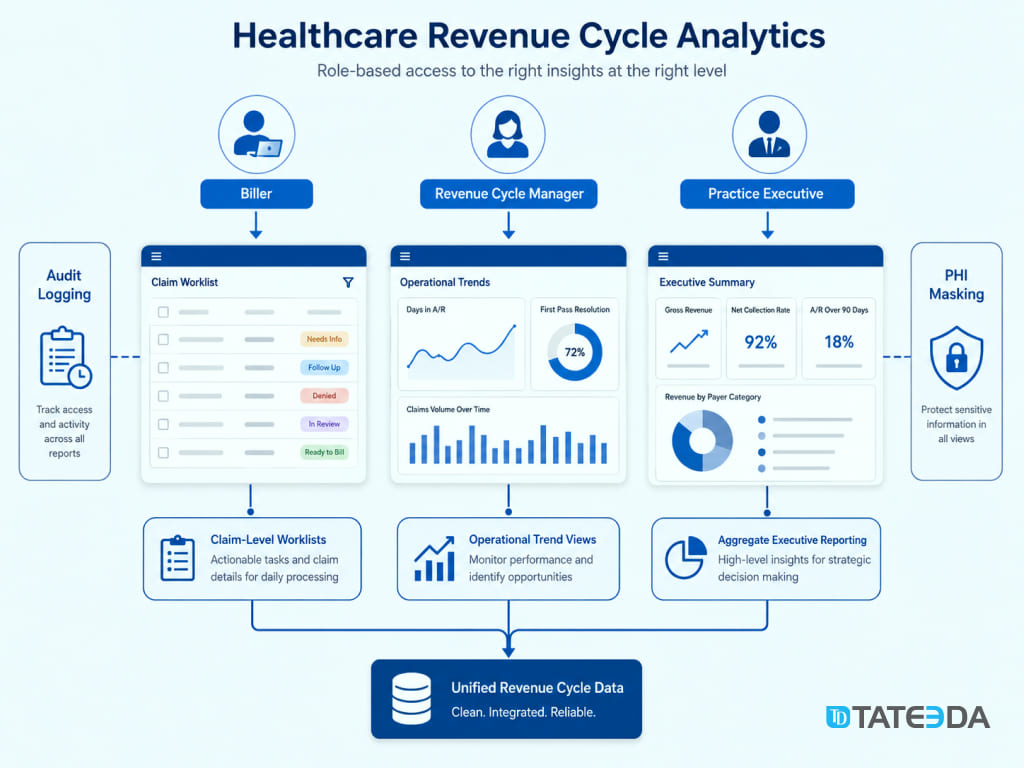
A revenue cycle analytics dashboard should not expose identical information to every user.
Role-specific views improve usability and reduce unnecessary PHI access.
Biller view
The biller view is transactional and worklist-focused.
It may include:
- unmatched claims;
- rejected claims;
- denied claims;
- claims approaching filing deadlines;
- appeal status;
- claim-level drill-down;
- service-line remittance detail;
- patient balance follow-up;
- payer response history;
- assigned owner and next action.
Billers may need claim-level PHI to work individual accounts. Access should follow job duties and be logged.
Revenue cycle manager view
The manager view is operational and trend-focused.
It may include:
- denial rate by payer;
- denial rate by category;
- clean claim rate;
- rejection rate;
- first-pass resolution;
- AR aging;
- unmatched claim volume;
- worklist backlog;
- payer response time;
- provider or location comparisons;
- recoverable denied amount;
- preventable denial share.
Managers may need claim-level access for review and escalation. Summary reporting can often use aggregate or masked data.
Practice executive view
The executive view is strategic.
It may include:
- net collection rate;
- days in AR;
- AR over 90 days;
- payer scorecards;
- monthly revenue trend;
- denial cost by category;
- reimbursement variance;
- unresolved claim exposure;
- performance by location or business entity.
This view should generally avoid patient identifiers. Aggregate tables and precomputed summaries can support executive reporting without exposing claim-level PHI.
[IMAGE 5: ]
HIPAA and access control in the analytics layer
Billing data can qualify as Protected Health Information when it contains patient identifiers linked to diagnoses, procedures, service dates, payer details, member identifiers, or claim information.
A revenue cycle analytics environment should therefore be treated as a PHI environment from its initial data load.
HIPAA permits uses and disclosures for Treatment, Payment, and Health Care Operations under defined conditions. HHS explains these activities in its official guidance on Treatment, Payment, and Health Care Operations.
Revenue cycle analytics frequently supports Payment or Health Care Operations. That permission does not remove the need for security and privacy controls.
A controlled analytics environment should include:
- role-based permissions;
- minimum-necessary access;
- strong authentication;
- access approval procedures;
- audit controls;
- PHI masking where appropriate;
- secure data transfer;
- vendor and BAA review;
- retention policies;
- incident-response procedures;
- documented administrative access;
- environment separation.
The HHS HIPAA Security Rule summary describes administrative, physical, and technical safeguards for electronic protected health information.
Warehouse and BI access should be planned before large volumes of billing data are loaded.
Audit controls and retention
The analytics environment should record access to ePHI where appropriate.
Useful audit information can include:
- user identity;
- access time;
- dashboard or dataset accessed;
- query or export activity;
- administrative changes;
- permission changes;
- patient-level drill-down;
- failed access attempts.
Retention should follow the organization’s legal, security, contractual, and HIPAA documentation policies. The appropriate period should be approved by compliance and legal stakeholders rather than inserted as a generic setting without review.
BI tools and BAA coverage
A BI, cloud, integration, or analytics vendor that creates, receives, maintains, or transmits PHI may need to operate under a Business Associate Agreement.
Do not assume a product is covered merely because its vendor offers healthcare services. Coverage can depend on:
- the signed agreement;
- the purchased product edition;
- the services listed as in scope;
- hosting configuration;
- connected features;
- customer-side security settings;
- support and telemetry arrangements.
Legal, compliance, security, and vendor-management teams should confirm coverage before PHI enters the platform.
For a broader discussion of healthcare analytics controls, read TATEEDA’s medical practice analytics software guide.
Build versus buy: when a custom dashboard makes sense
Many RCM and practice management vendors include built-in reporting.
For a single-system, single-clearinghouse practice with standard reporting needs, native reports may be sufficient for everyday monitoring.
A custom revenue cycle analytics dashboard becomes more relevant when one vendor’s reporting boundary no longer represents the entire revenue cycle.
Multiple clearinghouses
If claims route through two or more clearinghouses, one built-in report may not show all submissions, rejections, unmatched claims, payer responses, or remittance records.
A separate analytics layer can normalize those sources.
Multiple practice management systems
Organizations that grow through acquisition often inherit different payer names, provider identifiers, claim statuses, billing entities, and reporting formulas.
A shared warehouse can create common dimensions and KPI definitions across systems.
Custom payer scorecards
A payer scorecard may need:
- denial rate;
- rejection rate;
- average response time;
- reimbursement variance;
- underpayment patterns;
- authorization issues;
- timely-filing exposure;
- unresolved claim value;
- payer-specific policy categories.
Native dashboards may not support every contract rule or local workflow.
EHR-to-billing joins
Some financial questions require clinical and billing context together.
Examples include:
- documentation timing versus claim delay;
- diagnosis patterns versus denial outcomes;
- encounter type versus reimbursement;
- provider workload versus claim volume;
- procedure records versus submitted claim lines.
These joins require access to both clinical and financial systems.
TATEEDA’s EHR and EMR software development services cover EHR architecture, FHIR and HL7 integrations, clinical workflows, and connections between EHR, billing, insurance, and analytics systems.
Expected timeline
A focused first release may connect one practice management system and one clearinghouse with a limited KPI set.
A broader version may add:
- multiple clearinghouses;
- direct ERA ingestion;
- EHR data;
- payer contract data;
- AR snapshots;
- denial taxonomies;
- role-specific dashboards;
- audit controls;
- historical backfill;
- data-quality monitoring.
A focused build can take several months. A multi-source environment can take longer.
The timeline depends on:
- source-system access;
- vendor approval;
- historical data quality;
- payer mix;
- file and API availability;
- identity matching;
- PHI controls;
- dashboard depth;
- testing requirements.
Illustrative scenario: an acquisition made revenue leakage invisible
A four-location orthopedics group grows through acquisition and begins operating two practice management systems under different billing entities.
Leadership wants a unified denial view. The internal team cannot produce one because the systems use different payer names, provider identifiers, claim statuses, and formulas.
After the analytics layer is created, the first cross-entity report shows that one business unit has a materially lower net collection rate.
The cause is not billing-team productivity. A credentialing delay affected several providers, and selected commercial claims were routed with incorrect identifiers.
Neither source system exposed the pattern clearly by itself. It became visible only after payer, provider, claim, acknowledgment, and remittance data were normalized into one model.
Engineering principles and next steps
A revenue cycle analytics dashboard can remain useful for years when its data model, KPI definitions, and access rules are handled properly from the start.
Model the full claim lifecycle
Do not model only submitted and paid claims.
Include:
- generated;
- submitted;
- acknowledged;
- rejected;
- accepted;
- pending;
- paid;
- partially paid;
- denied;
- reversed;
- corrected;
- appealed;
- secondary payer pending;
- closed.
This prevents unresolved claims from disappearing between technical stages.
Build the denial taxonomy before the final dashboard design
CARC and RARC normalization determines whether a denial dashboard produces operational insight or a code-frequency report.
Billing leaders, coding specialists, authorization teams, and revenue cycle managers should review the classification logic.
Test reconciliation with real source data
Production files can contain payer variations, missing identifiers, reversals, corrected claims, secondary-payer events, and unexpected sequencing.
Test reconciliation logic with representative files from the actual payer and clearinghouse mix.
Version KPI definitions
KPI formulas should live in controlled transformation code rather than only inside chart settings.
Clean claim rate, rejection rate, denial rate, AR aging, and net collection rate need documented definitions, automated checks, and change history.
Keep access role-specific
Claim-level worklists, manager trend reports, and executive dashboards should be separate.
Users should receive the data required for their job, without unnecessary access to patient identifiers.
Plan ownership and maintenance
Payers change rules. Vendors change exports. Practices add locations. Providers enter and leave networks. Contract terms change.
The analytics layer needs:
- pipeline monitoring;
- data-quality checks;
- ownership;
- incident handling;
- mapping maintenance;
- permission review;
- KPI governance;
- documentation.
Building a revenue cycle analytics dashboard requires healthcare billing knowledge and data-engineering experience: 837 and 835 transactions, acknowledgments, CARC/RARC interpretation, clearinghouse data paths, HIPAA safeguards, dimensional modeling, AR snapshots, and access control.
TATEEDA’s custom healthcare software development services cover billing and RCM products, EHR integrations, healthcare APIs, analytics, cloud systems, and compliance-sensitive software projects.
If you are evaluating a revenue cycle analytics dashboard, begin with technical discovery. Inventory your practice management systems, clearinghouse routes, payer mix, available files, current reports, denial categories, AR requirements, and dashboard users.
Use TATEEDA’s software cost estimator to define the initial scope, or contact the TATEEDA team to discuss your data sources and reporting requirements.
FAQ
What is a revenue cycle analytics dashboard?
A revenue cycle analytics dashboard combines claim submissions, acknowledgments, payer remittance, claim status, AR, denial, and payment information into operational views for billing teams, revenue cycle managers, and executives.
How is it different from a practice management system report?
A practice management report usually queries the data stored in that specific platform. A custom analytics dashboard can combine practice management data with clearinghouse acknowledgments, payer remittance, claim-status feeds, contract data, and EHR context.
What is the difference between a claim rejection and a claim denial?
A rejection normally happens before final payer adjudication. It can occur because a file or claim failed syntax, format, required-field, or front-end validation.
A denial occurs after payer adjudication. The payer processes the claim and applies adjustment or remark codes explaining non-payment, reduced payment, or another outcome.
Why is the 835 important?
The 835 contains structured payer adjudication and remittance information, including payment, adjustment, patient responsibility, CARC, and RARC data.
It is necessary for detailed payer-denial and reimbursement analysis.
Can a dashboard use only 835 data?
No. A dashboard that uses only 835 data can miss rejected claims, failed submissions, and pending claims that have not reached final adjudication.
A complete claim-lifecycle view may also need 837 records, 999 acknowledgments, 277CA acknowledgments, 276/277 status, and clearinghouse status feeds.
Why does AR aging need a snapshot table?
Balances change after payments, adjustments, transfers, and write-offs. Recalculating past AR from today’s balances can alter historical reports.
A snapshot table preserves the balance and aging category recorded on each reporting date.
Does HIPAA allow revenue cycle analytics using PHI?
HIPAA permits many payment and healthcare operations activities involving PHI. The system still needs minimum-necessary access, role-based permissions, audit controls, secure vendor arrangements, and documented safeguards.
Which users need claim-level access?
Billers and revenue cycle specialists may need claim-level information to work on rejections, denials, appeals, and unpaid claims. Executives usually need aggregate reporting without patient identifiers.
How long does a custom revenue cycle analytics dashboard take to build?
A focused dashboard using one or two source systems may take several months. Multiple clearinghouses, EHR integration, AR snapshots, custom payer scorecards, historical migration, and role-based access can extend the project.

Ready to build your revenue cycle analytics dashboard?
TATEEDA helps healthcare organizations connect billing, clearinghouse, payer, and EHR data into practical analytics products with secure architecture, role-based access, denial intelligence, AR reporting, and senior engineering support.


![8 Healthcare RAG Development Companies in California [2026]](https://tateeda.com/wp-content/uploads/2026/10/Cover-img-2.jpg)
![Top 10 Healthcare AI Agent Developers in California [2026]](https://tateeda.com/wp-content/uploads/2026/09/Tateeda-illustration-2-1.png)