Medical Practice Analytics Software: Turning EHR, Billing, Portal, and Scheduling Data into Operational Insights

Slava Khristich



Vlad Nazarov

In this article, we explain how medical practice analytics software turns EHR, billing, patient portal, and scheduling data into reliable dashboards for revenue cycle, patient access, provider productivity, and clinical operations. You will see which data sources matter, how FHIR, HL7, EDI, MPI, HIPAA controls, and dashboard roles fit together, and how to plan a safer analytics build for a healthcare practice.
Medical practice analytics software is a unified reporting and intelligence layer that combines data from four core operational systems: the Electronic Health Record (EHR), billing and revenue cycle platform, patient portal, and scheduling or practice management system.
When built correctly, it answers questions that no single platform can answer alone.
A practice manager can see why provider schedules look full, but revenue still trails expectations. A billing lead can detect payer-specific denial patterns before accounts receivable ages out. A clinical director can compare care workflows, documentation quality, and operational bottlenecks without waiting for five spreadsheet exports from five different teams.
The need is not theoretical. In a January 2026 MGMA Stat poll, medical group leaders named denials and appeals as the largest revenue cycle leak, ahead of front-end issues, billing and collections, coding, and charge posting. The MGMA revenue cycle poll reported denials and appeals as the top leak for 48% of respondents, which makes clean claim data, payer trend analysis, and denial monitoring an urgent operational issue for practices.
Administrative automation is also becoming a hard financial topic, not just an IT modernization theme. The 2025 CAQH Index, released in February 2026, reported that U.S. healthcare avoided an estimated $258 billion in administrative costs in 2024 through electronic transactions and improved data exchange. That same pattern explains why practice analytics cannot rely on manual spreadsheets forever. Claims, eligibility, remittance, portal activity, and scheduling events need to move through controlled data pipelines.
The policy environment adds another reason to take analytics architecture seriously. CMS issued the CY 2026 Medicare Physician Fee Schedule final rule, with payment and Medicare Part B policy changes effective on or after January 1, 2026. Meanwhile, ONC and HHS announced in June 2026 that the TEFCA network reached the milestone of one billion health records exchanged. More health data is moving. More practice decisions depend on it. The analytics layer has to be ready.
That is the point of medical practice analytics software. It does not replace the EHR, billing system, or patient portal. It connects them, cleans the data, resolves identity gaps, and turns disconnected records into usable business, clinical, and operational insight.
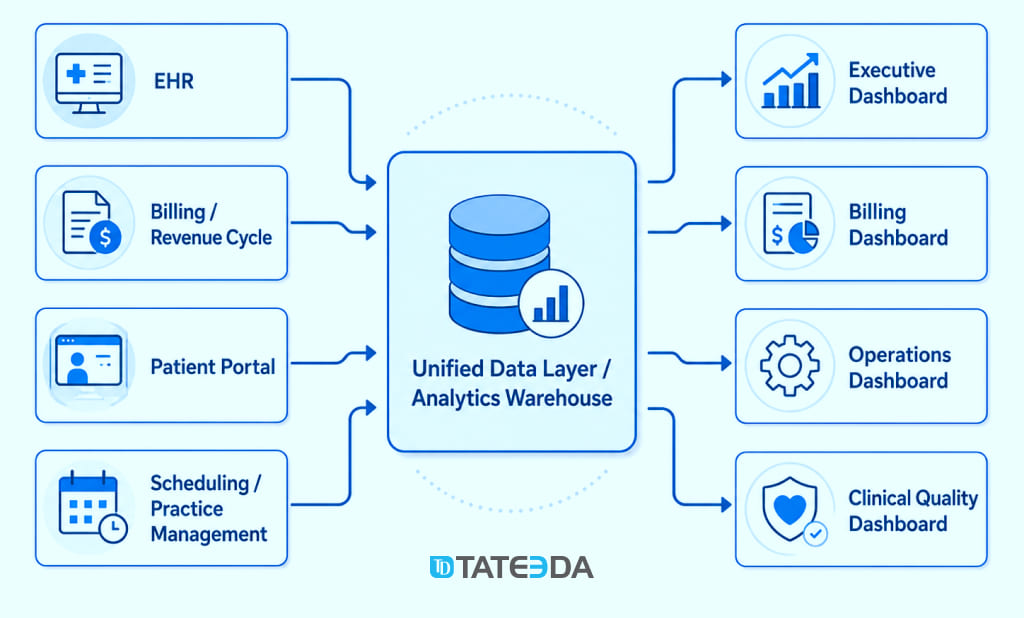
In a typical multi-provider practice, operational data sits in separate systems. The EHR holds diagnoses, procedures, encounters, lab results, and medication information. The billing platform tracks claims, remittances, denials, balances, and payment status. The portal records patient engagement signals, such as form completion, secure messages, and self-scheduling. The scheduling system tracks booked visits, cancellations, no-shows, slot use, provider templates, and location capacity.
Individually, those systems are useful. Together, they show how the practice actually works.
This article explains how to build medical practice analytics software from the ground up: source-system extraction, FHIR R4, HL7 v2, EDI 835 and 837 data, Master Patient Index design, analytics warehouse modeling, dashboard KPIs, HIPAA access control, and next steps for technical scoping.
If your team is already planning an analytics build that depends on EHR integration, TATEEDA’s EHR software development services cover FHIR API design, SMART on FHIR authorization, clinical data exchange, and integration planning for healthcare software products.
Key takeaways:
- Medical practice analytics software is only as good as the unified data layer behind it. The dashboard is the visible output; the integration layer is the actual product.
- FHIR R4 is the main path for EHR analytics software when certified EHR APIs are available, especially for clinical resources like Patient, Encounter, Condition, Procedure, Observation, and MedicationRequest.
- EDI 835 Electronic Remittance Advice is the source of truth for revenue cycle analytics because it shows what payers actually paid, adjusted, or denied.
- The Master Patient Index (MPI) problem is usually the hidden blocker. Patient IDs differ across EHR, billing, portal, and scheduling systems.
- HIPAA permits many analytics activities under Treatment, Payment, and Healthcare Operations, but the analytics layer still needs role-based access, audit logging, vendor review, and minimum-necessary PHI exposure.
- A practice analytics dashboard should separate executive summaries from billing, operations, and clinical quality views. Different users need different levels of data access.
Table of Contents
Why medical practice analytics software fails without a unified data layer
Medical practice analytics software usually fails for one of three reasons.
The first is source-system fragmentation. A practice may have one EHR, one practice management platform, one clearinghouse portal, one patient portal, one call-center tool, one referral tracker, and several spreadsheets. Each system has its own data rules. Each system may use a different patient identifier, provider code, payer name, appointment status, and timestamp format.
The second reason is manual reporting. Staff export spreadsheets, merge them by hand, clean obvious duplicates, create pivot tables, and circulate reports by email. The report may answer one question, once. It cannot support repeatable analytics, audit trails, data lineage, or controlled PHI access.
The third reason is dashboard-first thinking. A vendor or internal team starts with charts before solving extraction, identity matching, access control, and warehouse modeling. The result looks convincing for two weeks. Then the practice discovers that totals do not match billing, no-show rates differ from scheduling, or provider productivity excludes encounters with late documentation.
Medical practice analytics software cannot be treated as a visual reporting project. It is a healthcare data integration project with a dashboard layer on top.
A useful system needs:
- source connectors for EHR, billing, portal, and scheduling data;
- a canonical patient identity model;
- provider, payer, facility, and date dimensions;
- repeatable extraction and load routines;
- transformation logic that can be versioned and tested;
- dashboard views mapped to specific user roles;
- HIPAA access controls and audit logs;
- clear data lineage from each source system to each KPI.
Without that foundation, reporting stays fragile. With it, practice leadership can ask better questions: Why did denials rise for one payer? Which visit types lead to avoidable no-shows? Which providers lose capacity because of scheduling templates? Which patient segments have high balances and low portal activity? Which operational workflow creates the most downstream rework?
That is where healthcare practice reporting software becomes more than a reporting screen. It becomes an operational control layer.
Data source 1: EHR data via FHIR R4
EHR data is the clinical backbone of medical practice analytics software. It gives context to appointments, claims, and patient activity. Without EHR data, a practice can measure business volume. With EHR data, it can connect that volume to diagnoses, procedures, care pathways, documentation patterns, and clinical workload.
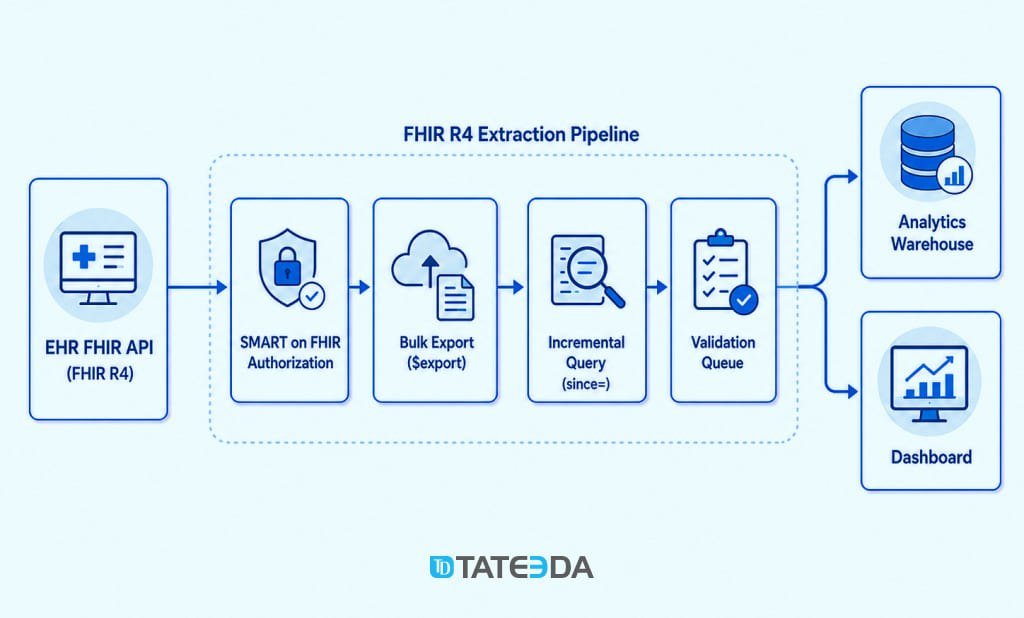
FHIR R4 is the main standard for modern EHR API access in the United States. ONC’s Cures Act Final Rule supports secure access, exchange, and use of electronic health information, with standardized APIs playing a central role in patient and provider access to structured health data.
That does not mean every EHR exposes every resource equally. It also does not mean every analytics use case can be built with a generic connector. Before development begins, the integration team should review the target EHR’s capability statement, implementation guides, authorization documentation, sandbox rules, rate limits, and production approval path.
For EHR analytics software, these FHIR resources are usually the starting point:
Patient: demographic and identity anchor for cross-system matching;Encounter: clinical event linking patient, provider, location, date, and visit context;Condition: diagnoses and problem-list entries;Procedure: completed procedures, often tied to CPT or HCPCS concepts;Observation: vitals, lab values, and structured clinical findings;DiagnosticReport: grouped diagnostic results and related observations;MedicationRequest: prescribed medications and medication workflow context;Appointment: scheduling data where the target system supports this resource;PractitionerandOrganization: provider and facility reference data.
FHIR data should not be dumped blindly into a dashboard. It needs normalization. Encounter status values need interpretation. Provider references need mapping. Coding systems need validation. Clinical dates need careful handling. A dashboard that counts the wrong encounter status, for example, can quietly distort provider productivity and visit-volume analytics.
Bulk export versus incremental FHIR queries
For larger EHR analytics loads, FHIR Bulk Data export is often the better pattern. The $export operation can request large resource sets, commonly delivered as NDJSON files. That is more practical for data warehouse loading than thousands of small API calls.
For fresher operational dashboards, standard FHIR search with _lastUpdated can support incremental pulls. This pattern is useful for daily or intra-day reporting, but it needs a careful change-detection design. Late-arriving updates, deleted records, merged patients, and partial source-system changes can create subtle errors.
In practice, many systems use both methods:
- bulk export for historical backfill and periodic full refreshes;
- incremental FHIR queries for changed records;
- reconciliation jobs to catch records missed by timing, vendor API limits, or source-system behavior.
For teams that need EHR integration planning before building analytics, TATEEDA’s EHR software development services can support FHIR API design, SMART on FHIR authorization, sandbox preparation, and production integration planning.
Data source 2: Billing and revenue cycle data via EDI and API
Billing data tells the practice what was submitted, paid, adjusted, denied, appealed, written off, or still unpaid. It is the center of revenue cycle analytics and one of the most valuable data feeds in medical practice analytics software.
The difficulty is that billing data rarely sits in one clean place.
A practice management platform may store charges and claim records. A clearinghouse may store claim status and eligibility responses. Payers send structured remittance data. Staff may track appeals in a separate tool. Payment plans may live in another patient payment system.
Medical billing software data must be integrated with scheduling and clinical data to reveal the full revenue story.
EDI 837 and EDI 835
The EDI 837 transaction is the electronic claim. The 837P version is used for professional claims, while 837I applies to institutional claims. It shows what the provider submitted.
The EDI 835 transaction is the Electronic Remittance Advice. It shows what happened after submission: the paid amount, the allowed amount, the patient responsibility, the payer adjustments, the denial codes, and the remittance details.
For analytics, the 835 is especially important. A claim dashboard built only from submitted claims is incomplete. The 837 shows intent. The 835 shows reality.
A strong revenue cycle analytics layer should match 837 claim submissions to 835 remittance lines, usually through internal claim IDs, payer claim control numbers, service dates, procedure codes, payer identifiers, and payment information.
This unlocks questions like:
- Which payer denies the same procedure most often?
- Which CPT and modifier combinations cause the highest denial rate?
- Which providers have higher first-pass claim acceptance?
- Which claim types stay unpaid beyond 30, 60, or 90 days?
- Which denial categories are rising month over month?
- Which locations generate more preventable claim rework?
That is where practice management analytics becomes more valuable than standard billing reports. It connects financial outcomes to scheduling patterns, provider activity, documentation behavior, and patient workflows.
Clearinghouse APIs
In many practices, the most practical billing integration point is the clearinghouse. Waystar, Availity, Optum-related systems, and other clearinghouse platforms may expose claim status, eligibility, remittance, and payment data through APIs or structured exports.
Raw X12 EDI parsing is still sometimes required. It is not glamorous work. It is exacting, brittle, and packed with edge cases. But it matters. A clean EDI 835 parser can turn a pile of remittance files into denial analytics, payer scorecards, and AR aging views that billing teams can use every day.
If your product requires custom billing workflows, denial analytics, patient payments, or payer-data integration, TATEEDA’s medical billing software development experience can support the revenue cycle layer behind the dashboard.
Data source 3: Patient portal data
Patient portal data is often ignored. That is a mistake.
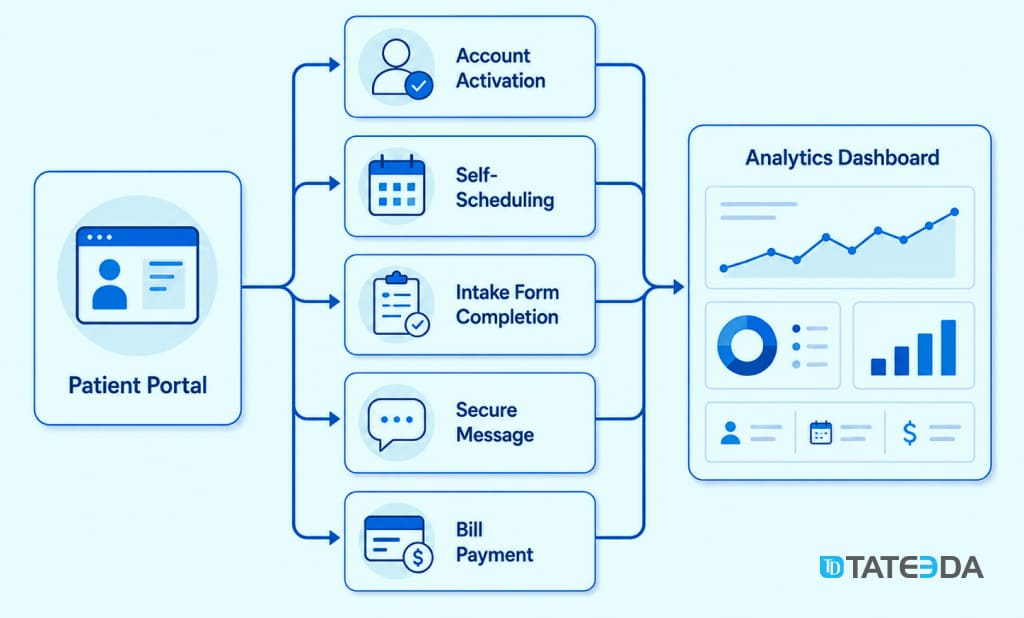
A portal contains the patient-side behavior that helps explain operational results. Did the patient activate their account? Did they complete pre-visit forms? Did they send secure messages? Did they schedule online? Did they abandon the intake process? Did they view lab results? Did they respond to reminders?
This data can help medical practice analytics software connect engagement patterns to no-shows, appointment completion, billing problems, and follow-up workflows.
Useful portal metrics include:
- portal activation rate;
- self-scheduled appointment share;
- pre-visit form completion rate;
- secure message volume by patient segment;
- average response time to patient messages;
- lab-result view rate;
- post-visit instruction view rate;
- payment-link click-through and payment completion;
- abandoned form or intake sessions.
Custom-built portals are usually easier to instrument because the development team controls the event model. EHR-native portals may require vendor APIs, FHIR resources, event exports, or reporting extracts. Either way, the analytics design should define events early.
For example, “form completed” should not mean the same thing as “form opened.” “Message sent” should not be counted as “message resolved.” “Appointment requested” should not be confused with “appointment booked.”
Small event-definition mistakes can distort a practice analytics dashboard very quickly.
Data source 4: Scheduling and practice management data
Scheduling data is the operational pulse of a medical practice. It shows what capacity was available, what was booked, what was canceled, what was missed, and what provider time was actually used.
For medical practice analytics software, scheduling data is needed for:
- no-show rate;
- cancellation rate;
- time to next available appointment;
- provider slot use;
- location capacity;
- appointment type demand;
- visit completion rate;
- patient access metrics;
- referral-to-appointment conversion;
- overbooking and underbooking patterns.
Older practice management systems often exchange scheduling data through HL7 v2 SIU messages. Common examples include:
SIU^S12: new appointment booked;SIU^S13: appointment rescheduled;SIU^S15: appointment canceled;SIU^S17: appointment deleted or marked as no-show.
Newer systems may expose scheduling data through the FHIR Appointment resource or proprietary APIs. The right integration pattern depends on the source platform.
Scheduling analytics becomes more powerful when joined with billing and portal data. For example, a high no-show rate may not be a patient-access problem. It may be a reminder issue. Or a payer issue. Or a visit-type issue. Or a location-specific transportation issue. Or a portal adoption issue.
A dashboard that sees scheduling alone can report the problem. A dashboard that joins scheduling, portal, payer, and patient history can point to the cause.
Building the unified integration architecture
The unified data layer is the heart of medical practice analytics software. It connects four source categories that were not built to share data neatly.
The main architectural tasks are:
- Extract data from source systems.
- Resolve patient, provider, payer, and facility identity.
- Load raw data into a controlled staging area.
- Transform it into analytics-ready tables.
- Apply access control and audit logging.
- Expose role-specific dashboards and exports.
Solving the Master Patient Index problem
Every system has its own patient identifier.
The EHR may use a Medical Record Number. The billing system may use an account number. The portal may use a user ID. The scheduling platform may have its own patient record ID. A patient may also appear with name variations, old addresses, missing phone numbers, or changed insurance details.
A Master Patient Index resolves these records to one canonical patient identity.
There are two common matching patterns.
Deterministic matching uses exact rules. If the first name, last name, date of birth, and another strong identifier match, records can be linked. This is fast and easy to audit, but it breaks when records contain typos, changed names, or missing fields.
Probabilistic matching uses scoring. It compares fields like name, date of birth, phone, address, email, and zip code, then assigns a confidence score. High-confidence matches can be linked automatically. Medium-confidence matches can be sent to manual review.
For smaller practices, a well-built probabilistic matching routine may be enough. For larger networks, enterprise MPI products may be worth considering. The important point is simple: without identity resolution, cross-source analytics will produce unreliable numbers.
ETL versus ELT for healthcare analytics
Healthcare analytics teams usually choose between ETL and ELT.
ETL means Extract, Transform, Load. Data is transformed before it enters the analytics warehouse. This gives the team more control before PHI lands in the reporting environment, but it can slow experimentation.
ELT means Extract, Load, Transform. Raw data lands first, then transformation happens inside the warehouse. This gives data engineers more flexibility, but the staging layer now contains raw PHI. That means staging tables need the same seriousness as production clinical systems: access controls, logging, retention rules, and monitoring.
For many medical practice analytics software projects, ELT is practical if the access model is planned early. The warehouse should not become a casual dumping ground. Raw data, transformed data, and dashboard-ready data should live in separate zones with separate permissions.
Star schema for medical practice analytics software
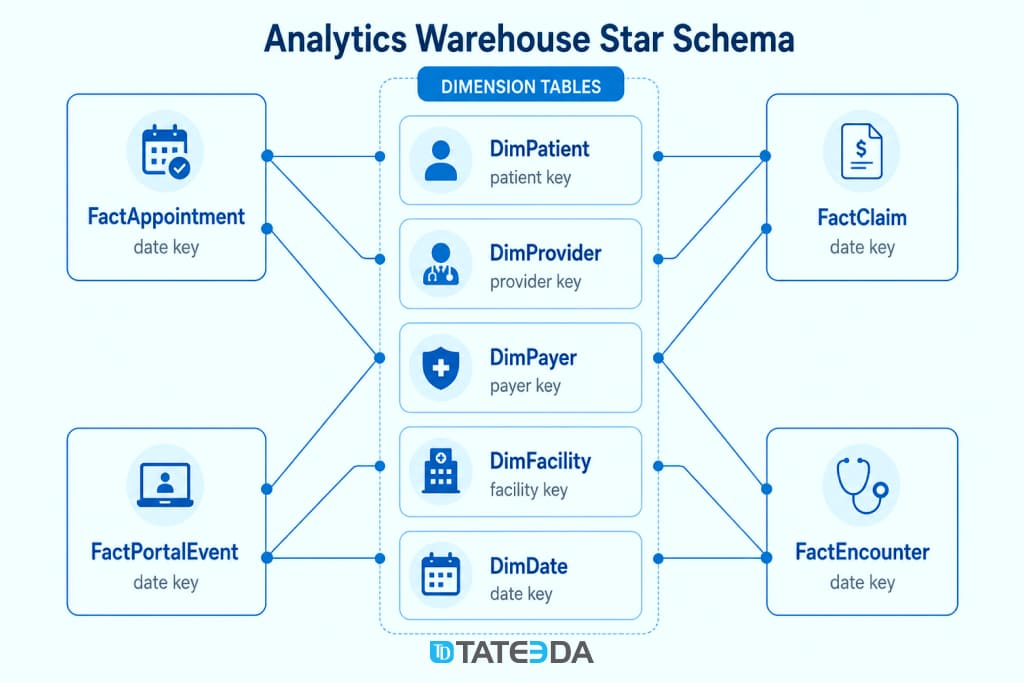
A dimensional model is usually the right fit for medical practice analytics software because it makes KPI queries faster and easier to maintain.
A common design may include:
FactAppointment: one row per appointment, with patient, provider, facility, date, appointment type, and status references;FactClaim: one row per claim line, with patient, provider, payer, procedure, billed amount, paid amount, adjustment, and denial code;FactEncounter: one row per clinical encounter, with patient, provider, diagnosis, visit type, and date references;FactPortalEvent: one row per patient portal event, with patient, event type, event time, and source context;DimPatient: canonical patient identity after MPI matching;DimProvider: provider identity across EHR, billing, and scheduling systems;DimPayer: payer normalization across claim and remittance records;DimDate: shared calendar dimension for trend reporting;DimFacility: location and clinic-site dimension.
This structure lets the practice analyze operational questions across domains. For example, the system can join appointment history, portal activation, payer type, claim denial data, and encounter volume without forcing analysts to rebuild joins inside every dashboard.
TATEEDA’s custom software integration for healthcare teams supports FHIR-to-warehouse pipelines, HL7 v2 listeners, EDI parsing, API integration, and dimensional data models for healthcare analytics environments.
Medical practice analytics software KPIs: what each data source enables
A practice analytics dashboard should not show every available metric. It should show metrics that connect to decisions.
Billing teams need denial and AR data. Operations managers need scheduling and capacity data. Clinical leaders need encounter, documentation, and quality views. Executives need trend summaries, exceptions, and financial impact.
Below is a practical KPI map for medical practice analytics software.
| KPI | Primary data source | Recommended refresh | Notes |
|---|---|---|---|
| Clean claim rate | Billing, EDI 837 | Daily | Tracks claim quality before payer response |
| Denial rate | Billing, EDI 835 | Daily | Should be segmented by payer, CPT, provider, location |
| Denial rate by payer | Billing, EDI 835 | Daily | Helps expose payer-specific rule changes |
| Days in AR | Billing | Daily | Must separate payer AR and patient AR |
| Net collection rate | Billing, EDI 835 | Monthly | Useful executive and revenue cycle KPI |
| First-pass yield | EDI 837 and 835 | Daily | Measures claims paid without rework |
| No-show rate | Scheduling | Same day or daily | Should be segmented by visit type, location, reminder status |
| Cancellation rate | Scheduling | Daily | Separate patient cancellations from provider or office cancellations |
| Slot use | Scheduling | Daily | Measures provider schedule fill and unused capacity |
| Time to next available appointment | Scheduling | Same day or daily | Important for access and growth planning |
| Provider wRVU | EHR and billing | Weekly or monthly | Requires specialty-specific interpretation |
| Revenue per provider day | EHR and billing | Weekly | Useful only with visit mix and payer context |
| Portal activation rate | Patient portal | Weekly | Useful patient engagement signal |
| Self-scheduling share | Portal and scheduling | Weekly | Helps evaluate digital access adoption |
| Message response time | Patient portal | Daily | Should separate clinical, billing, and admin messages |
For provider productivity and reimbursement analysis, the CMS Physician Fee Schedule remains an important reference for RVU-related data and Medicare payment policy. Practices still need specialty-specific benchmarks and payer-mix context, but CMS data gives the analytics team a common technical reference point for many procedure-level calculations.
The key is not the table itself. The key is how metrics combine.
A denial-rate chart is useful. A denial-rate chart joined with payer, CPT, modifier, provider, appointment type, and documentation timing is much better. It lets the team see whether a revenue problem begins with scheduling, documentation, coding, claim submission, payer behavior, or follow-up workflow.
That is the difference between generic reporting software and clinical analytics software development for real healthcare operations.
HIPAA compliance in medical practice analytics software
Analytics environments can become risky if teams treat them as “secondary” systems. The source EHR may have strong access controls, but exported data can lose those controls once it lands in a warehouse, BI platform, CSV folder, or analyst notebook.
Medical practice analytics software must be planned with HIPAA controls from the beginning.
PHI use for Treatment, Payment, and Healthcare Operations
HIPAA allows covered entities to use and disclose PHI for Treatment, Payment, and Healthcare Operations, subject to limits and protections. HHS explains that health care operations include certain administrative, financial, legal, and quality improvement activities needed to run the covered entity’s business and support treatment and payment. For reference, see the HHS guidance on Treatment, Payment, and Health Care Operations.
Many practice analytics activities fit under Payment or Healthcare Operations.
For example:
- denial-rate analysis supports payment operations;
- provider slot-use reporting supports healthcare operations;
- patient access reporting supports healthcare operations;
- claim appeal work may require claim-level patient identifiers;
- clinical quality review may require encounter-level patient context.
This does not mean every user should see all patient data. It means the analytics system needs a minimum-necessary access model.
Role-based access control
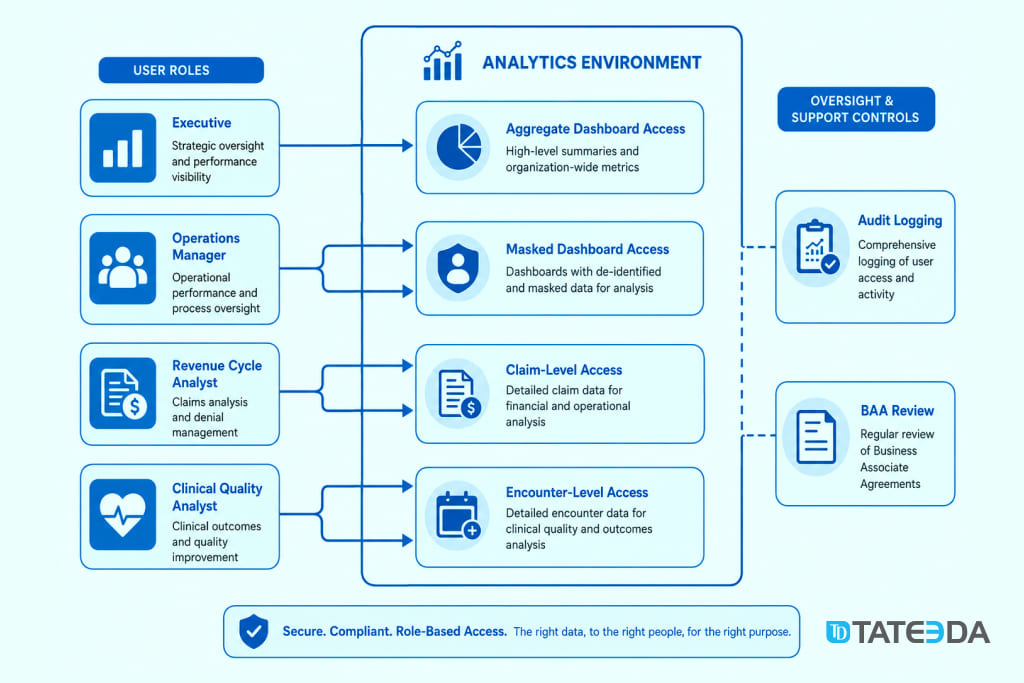
A practical analytics access model may include four tiers.
Clinical quality analysts may need encounter-level clinical data, including patient identifiers, to review care gaps, documentation patterns, and clinical workflows.
Revenue cycle analysts may need claim-level patient identifiers for denial appeals, payment posting, and AR follow-up, but they usually do not need full clinical notes.
Operations managers often need aggregate scheduling, capacity, and provider productivity views without patient identifiers.
Executives usually need trend dashboards, location summaries, provider summaries, and financial snapshots with little or no direct PHI exposure.
This access model should be enforced in the warehouse and BI layer, not left to informal team behavior. Column masking, row-level security, schema separation, dashboard permissions, and query logging all matter.
De-identification and masking
Not every dashboard needs PHI. Some views should use aggregated or masked data. HHS recognizes two HIPAA de-identification methods: Expert Determination and Safe Harbor. You can review the HHS guidance on de-identification of protected health information for details.
For many practice analytics dashboards, full de-identification is not always needed because the activity falls under Treatment, Payment, or Healthcare Operations. But masking is still good design.
A revenue cycle manager may need patient account detail for appeal work. A practice executive reviewing payer performance usually does not.
Audit logs and BAA review
Analytics access to PHI should be logged. The system should record who accessed data, when, what dashboard or query was used, and what level of data was exposed.
Vendors matter too. If a BI vendor, cloud provider, integration partner, or analytics tool receives PHI, the practice needs proper Business Associate Agreement review. A BI product without BAA support should not be used for identifiable patient data.
The HHS HIPAA Security Rule summary describes administrative, physical, and technical safeguards for electronic protected health information. Analytics environments are not exempt because they are “just reporting.”
Common engineering mistakes to avoid
Medical practice analytics software can look simple on the surface. Under the surface, it is full of failure points.
Mistake 1: Building dashboards before fixing source data
If provider names differ across systems, dashboard filters will lie. If payer names are not normalized, payer scorecards will split one payer into five records. If patient identity is not resolved, per-patient metrics will be wrong.
Data cleanup is not a finishing task. It is core engineering.
Mistake 2: Treating EHR APIs as identical
FHIR helps, but vendor behavior still differs. Supported resources, search parameters, rate limits, approval paths, sandbox behavior, and write policies vary. A connector that works for one EHR may need meaningful changes for another.
Medical practice analytics software should be designed around capability discovery, not assumptions.
Mistake 3: Ignoring late-arriving data
Claims can be adjusted weeks after submission. Encounters can be signed late. Appointments can be rescheduled multiple times. Portal messages can be reassigned. If the pipeline assumes data becomes final immediately, trend reports will drift.
The warehouse needs update handling, reconciliation jobs, and data freshness indicators.
Mistake 4: Leaving KPI formulas inside the BI tool
KPI formulas should not live only in dashboard configuration. They should be versioned, tested, and documented in the transformation layer.
A clean analytics build should define what “denial rate,” “slot use,” “first-pass yield,” and “time to next available appointment” mean in SQL models or transformation code, not in hidden chart settings.
Mistake 5: Giving too much PHI access by default
This is common and dangerous. Analysts often ask for raw data because it is easier. Good engineering gives users the data they need, not every field the source system can export.
Build a roadmap for medical practice analytics software
A practical build does not start with all dashboards at once. It starts with the highest-value data path and then expands.
Step 1. Define business questions
Start with decisions, not charts. Examples:
- Which payer causes the highest preventable denial rate?
- Which locations have unused provider capacity?
- Which appointment types lead to no-shows?
- Which patients are overdue for follow-up and inactive in the portal?
- Which provider schedules look full but underperform financially?
- Which intake gaps create claim delays?
These questions define the source systems, data model, and dashboards.
Step 2. Inventory source systems
List the EHR, billing platform, clearinghouse, portal, scheduling system, payment platform, and any related data exports. For each system, document:
- vendor and version;
- available APIs;
- export formats;
- authentication model;
- data owner;
- sandbox access;
- rate limits;
- reporting tables;
- approval process;
- PHI exposure points.
Step 3. Build the first data slice
Pick one domain with measurable value. Revenue cycle is often a strong starting point because denial reduction and AR improvement can justify the project quickly.
A first slice may include 837 claims, 835 remittance, payer normalization, denial categories, claim aging, and a denial dashboard.
Step 4. Add identity resolution
Build or integrate MPI logic before joining clinical, portal, and scheduling data. Identity resolution should include match scoring, merge rules, review queues, and an audit trail for manual corrections.
Step 5. Add scheduling and portal data
Once the revenue or clinical core works, add operational and patient engagement signals. This is where practice analytics becomes more useful. Scheduling data explains access and capacity. Portal data explains patient behavior.
Step 6. Add role-specific dashboards
Do not give everyone one giant dashboard. Build separate views:
- executive overview;
- revenue cycle dashboard;
- scheduling and capacity dashboard;
- provider productivity dashboard;
- patient engagement dashboard;
- clinical quality dashboard;
- data quality and pipeline health dashboard.
Step 7. Prepare support and governance
Medical practice analytics software needs ongoing care. Source APIs change. Payers change rules. Providers join or leave. Locations change. Appointment templates change. KPI definitions need review.
Plan ownership from the beginning: who maintains data models, who reviews KPI definitions, who handles access requests, who checks pipeline failures, and who approves dashboard changes.
Example use cases for medical practice analytics software
Revenue cycle control
A practice can track denial rate by payer, CPT, modifier, provider, location, and date of service. When denial patterns rise, billing teams can see whether the issue is payer policy, documentation timing, claim format, eligibility gaps, or internal coding behavior.
Provider productivity
Medical practice analytics software can combine encounters, billed procedures, schedules, and payment data to show provider productivity with context. A high-visit provider may not always generate higher collections. A lower-volume provider may handle more complex visit types. The analytics layer should show the nuance.
No-show reduction
Scheduling data alone can show no-shows. Joined with portal, payer, patient segment, appointment type, and reminder history, it can show why no-shows happen and where intervention may help.
Patient access monitoring
Time to next available appointment, location capacity, provider template gaps, and referral-to-visit conversion can help practices find access problems before patient satisfaction drops.
Clinical quality reporting
EHR data joined with appointment and portal behavior can help quality teams identify patients who need follow-up, chronic-care review, lab completion, or care-gap outreach.
Patient engagement analysis
Portal activation, secure message activity, self-scheduling, form completion, and result viewing can show which patient groups need better digital support.
Engineering principles for a system that lasts
Keep analytics read-only. The analytics layer should observe source systems, not write back into the EHR or billing platform. If the product needs write-back workflows, build them as separate integration paths with separate validation, error handling, and approvals.
Track data lineage. Every record should carry source-system context, extraction time, transformation version, and load time. Without lineage, the team cannot explain reporting changes after a vendor API update or source-system correction.
Version KPI logic. Definitions should live in controlled transformation code, not hidden inside dashboards. If the denial rate or no-show rate changes, the team should know exactly when and why.
Separate raw, transformed, and reporting data. Raw source data should not be broadly available. Reporting tables should expose only the fields needed for each user role.
Test pipelines like product code. Data pipelines need automated checks: null values, duplicate records, invalid codes, impossible dates, missing patient matches, unmapped payers, and source refresh failures.
Design for audits. Access logs, permission records, vendor BAAs, dashboard ownership, and data-retention logic should be ready before sensitive analytics goes live.
Medical practice analytics software needs more than connectors and charts. It needs discipline.
FAQ
What is medical practice analytics software?
Medical practice analytics software is a reporting and intelligence layer that combines EHR, billing, portal, and scheduling data into unified dashboards and data models. It helps medical practices analyze revenue cycle performance, provider productivity, patient access, portal engagement, clinical workflows, and operational issues across systems.
How is medical practice analytics software different from a generic BI tool?
A BI tool visualizes data. Medical practice analytics software includes the healthcare-specific integration layer under the visualization: FHIR extraction, HL7 messages, EDI parsing, MPI identity matching, PHI access control, audit logging, healthcare KPI logic, and dashboard roles. The BI tool is only one part of the full system.
What data sources are needed for a practice analytics dashboard?
The core data sources are the EHR, billing or practice management system, patient portal, and scheduling platform. Some practices also add clearinghouse data, payment systems, call-center tools, referral systems, quality reporting data, and data from custom internal applications.
Does HIPAA allow analytics on PHI?
HIPAA permits many analytics activities under Treatment, Payment, and Healthcare Operations, subject to limits and protections. The analytics system still needs minimum-necessary access, role-based permissions, audit logging, vendor review, and proper Business Associate Agreement coverage where vendors handle PHI.
Does every practice need a Master Patient Index?
Any practice that joins patient-level data across EHR, billing, portal, and scheduling systems needs some form of patient identity matching. Smaller practices may use custom deterministic and probabilistic matching logic. Larger networks may need a dedicated MPI product or service.
How long does it take to build medical practice analytics software?
A focused first version with two or three source systems and a limited KPI set may take several months. A fuller system with EHR, billing, portal, scheduling, MPI, warehouse modeling, access control, audit logs, and multiple dashboards takes longer. The timeline depends on vendor access, source-system quality, data volume, approval paths, and security requirements.
What is the best first dashboard to build?
Revenue cycle analytics is often the best first dashboard because it can show measurable financial impact. Denial rate, first-pass yield, days in AR, net collection rate, and payer-specific trends can reveal problems that translate into recoverable revenue.
Can medical practice analytics software support AI later?
Yes, if the data foundation is sound. Predictive no-show modeling, denial prediction, patient segmentation, message triage, and operational forecasting all depend on clean source data, stable identity matching, and controlled PHI access. AI should come after the data layer is trusted, not before.
Next steps: how TATEEDA can help
Building medical practice analytics software requires knowledge of healthcare data and depth in software engineering. The team must understand FHIR R4, HL7 v2, EDI 835 and 837, HIPAA, PHI access rules, data warehouse design, dashboard permissions, and the messy behavior of real healthcare source systems.
TATEEDA’s HIPAA-compliant healthcare software development team includes 100+ senior engineers with experience in EHR integration, medical billing systems, patient portals, healthcare workflow software, clinical data infrastructure, and custom analytics platforms.
Our VisionTree electronic data capture platform case study shows how TATEEDA supports structured clinical data collection and reporting workflows for healthcare and research environments.
If you are planning a medical practice analytics software build, start with a data source inventory and a technical discovery session. Define which systems must connect, which KPIs matter most, which users need access to, and which PHI controls are required.
Use TATEEDA’s software cost estimator to begin shaping the scope, or contact our healthcare engineering team to discuss your EHR, billing, portal, scheduling, and analytics requirements.

Ready to build your medical practice analytics layer?
TATEEDA helps healthcare companies connect EHR, billing, portal, and scheduling data into secure analytics products with clean architecture, HIPAA-aware access control, and practical dashboards for business and clinical operations.



![8 Healthcare RAG Development Companies in California [2026]](https://tateeda.com/wp-content/uploads/2026/10/Cover-img-2.jpg)
![Top 10 Healthcare AI Agent Developers in California [2026]](https://tateeda.com/wp-content/uploads/2026/09/Tateeda-illustration-2-1.png)